I’ve just published a Detroit Fire Incidents Dashboard on Tableau Public, covering all calls between 2017 and 2025. The Detroit Open Data Portal is our data source. Here’s a screenshot of the full dashboard:
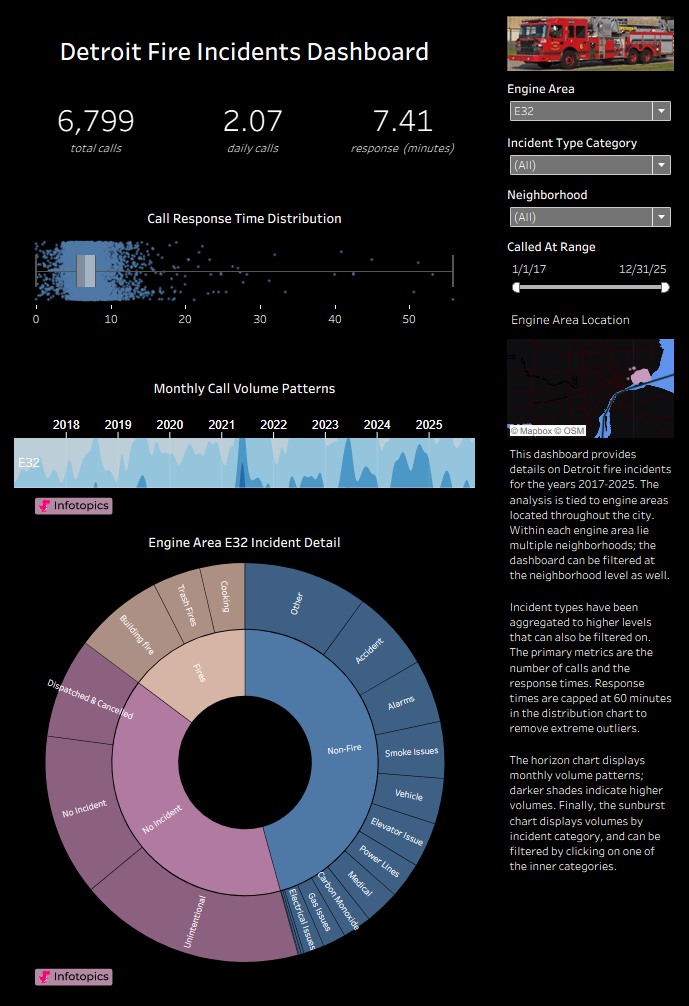
Detroit Fire Incidents Dashboard Anatomy
The dashboard contains a lot of information, so we’re going to learn more by walking through each section. Let’s begin with the summary section:
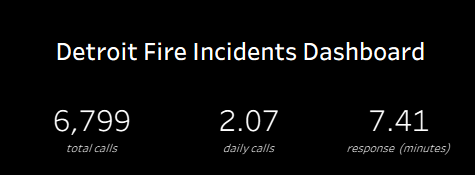
This is where we get a quick read on the number of calls, the average per day, and the average (mean) response time between the call time and arrival time. The data automatically updates based on the filters applied (engine area, neighborhood, incident category).
After finishing the summary section, we can move on to the call detail portion of the dashboard:
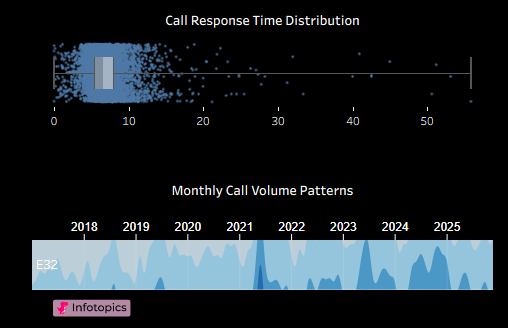
The first chart shows the response time distribution, with a box plot indicating the lower quartile, median, and upper quartile breakpoints. Each dot represents a specific incident call. We cap the plot at 60 minutes to remove extreme outliers and any potentially suspect data.
The second chart in the section is a horizon plot, showing peak periods (by month) for call volumes. Lighter shades indicate lighter volumes, and the darkest shades indicate peak periods. Why do we use a horizon plot – because horizon plots provide a compact format (compared to bar charts) for viewing time-series data.
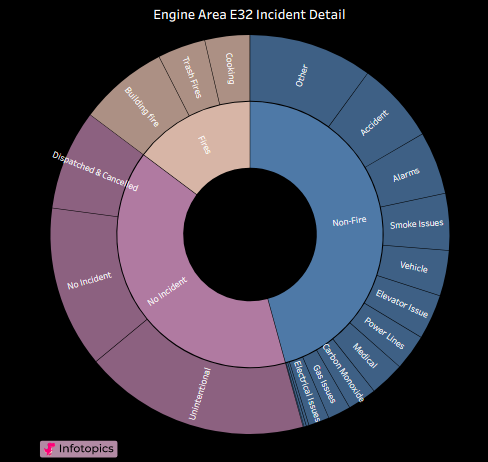
Our final chart in the dashboard is a sunburst chart, where two levels (or more) of data can be displayed. The inner ring contains aggregations (fire, non-fire, no incident), with the outer ring displaying more specific incident categories.
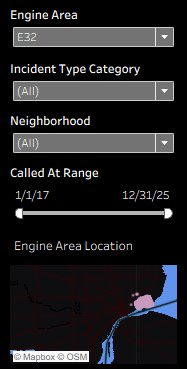
A set of simple filters controls the dashboard display elements. These filters focus on engine area, incident type, neighborhood, and call range, and can all be modified to update all dashboard elements. The bottom area of the filters displays the specific area selected within the city.
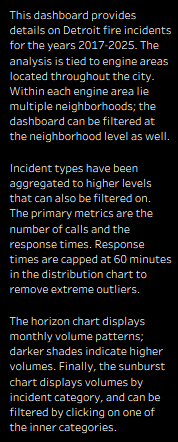
Finally, the dashboard contains a simple text overview providing details about the dashboard:
That wraps it up – here’s the dashboard link once more: Detroit Fire Incidents Dashboard