As part of our continuing series on crime in Detroit, I decided to focus on one of the most universal of all Detroit crimes – the stolen vehicle. This is arguably the most egalitarian criminal activity in the city, covering neighborhoods both poor and wealthy, downtown and outer neighborhoods. Interestingly, despite the negative perception of Detroit as a stolen vehicle mecca, the metro area (including Dearborn & Warren) ranks just 109th out of 382 metros, according to 2018 statistics from NICB, the National Insurance Crime Bureau.
Regardless of the ranking, the perception is that car theft is a major issue in the city, and one that touches people in almost all parts of the city. Detroit’s flat topography, wide streets, and low traffic volumes make it easy for thieves to target nearly any neighborhood in the city with minimal risk of being apprehended.
So given the above, are there areas that are especially vulnerable to car theft, or is it really quite random? Once again, we can use Exploratory to get some quick answers. Again, as a reminder, these are the nominal numbers, not calculated on a per capita basis. Nonetheless, they should present us with a directional picture of vehicle theft in the city, which we can confirm with some maps in a little while. Let’s take an initial look, ranked by the Top 25 neighborhoods for vehicle theft:
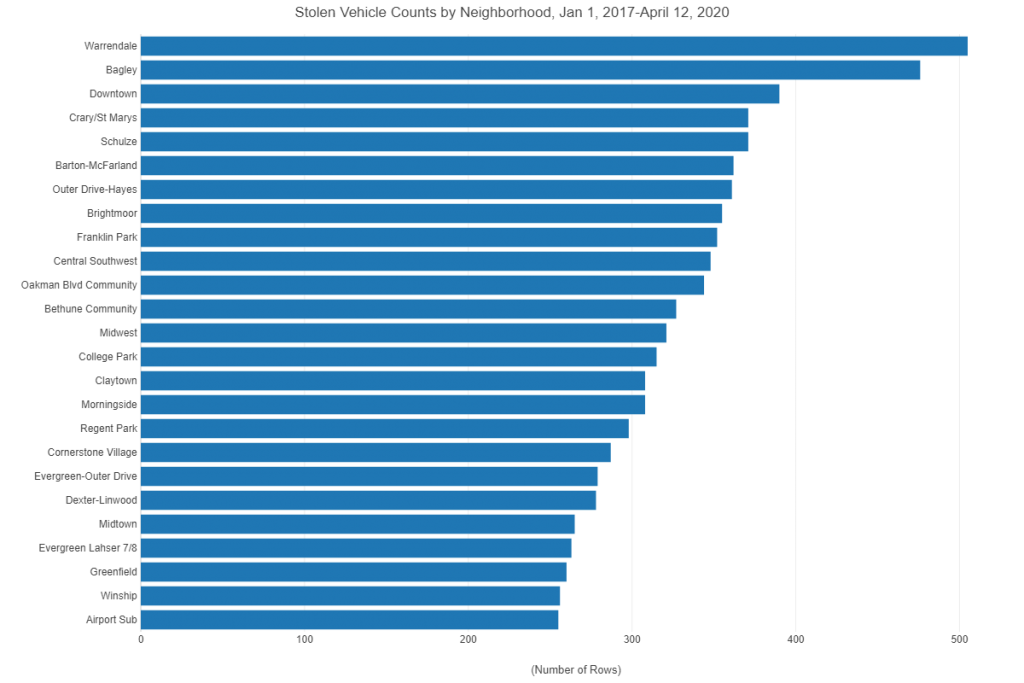
We can see from the chart that the Warrendale and Bagley neighborhoods lead the pack in stolen vehicle counts. Both neighborhoods are on the westside, but not adjacent to one another. Both are sizeable neighborhoods, especially Warrendale, so their high numbers are not shocking. There does seem to be a pattern with more neighborhoods from the westside ranking high in this category (Warrendale, Bagley, Crary/St. Mary’s, Schulze, Barton/McFarland hold down five of the top six spots); whether this is a reflection of higher levels of criminality or merely more opportunity (the westside tends to have higher population density) is unclear at this point. Our maps later in this post might help to shed some light on these patterns.
In a recent post, we used violin charts to look at the shape of crime based on the type of offense paired with the time of day. We can now do the same with stolen vehicle offenses, but this time organized by neighborhood:
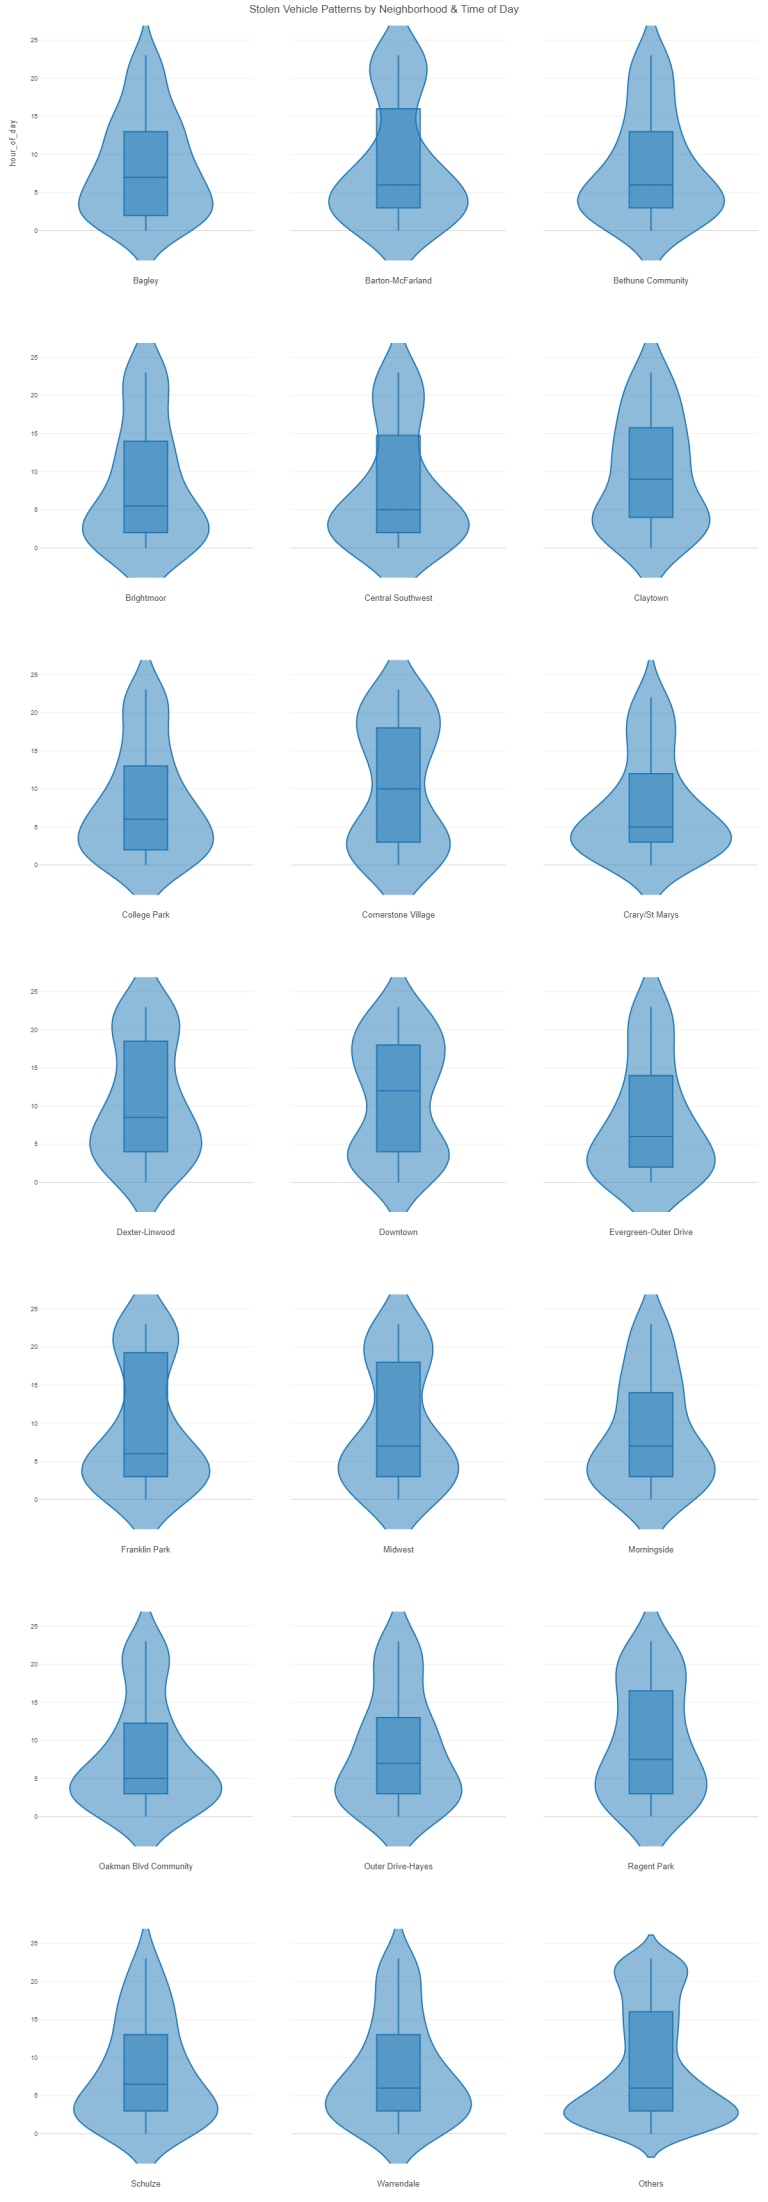
As you can see from a quick viewing, stolen vehicle incidents tend to peak between midnight (0 on the plots) and 5 AM (5 on the plots). This pattern is consistent across nearly all neighborhoods, and is not really a surprise. Vehicle theft is more easily accomplished under cover of darkness, when owners are often asleep for the night. Our next question is whether we see any sort of daily pattern, showing the day of the week on the axis (1 for Sunday, 7 for Saturday) . Here are the results:
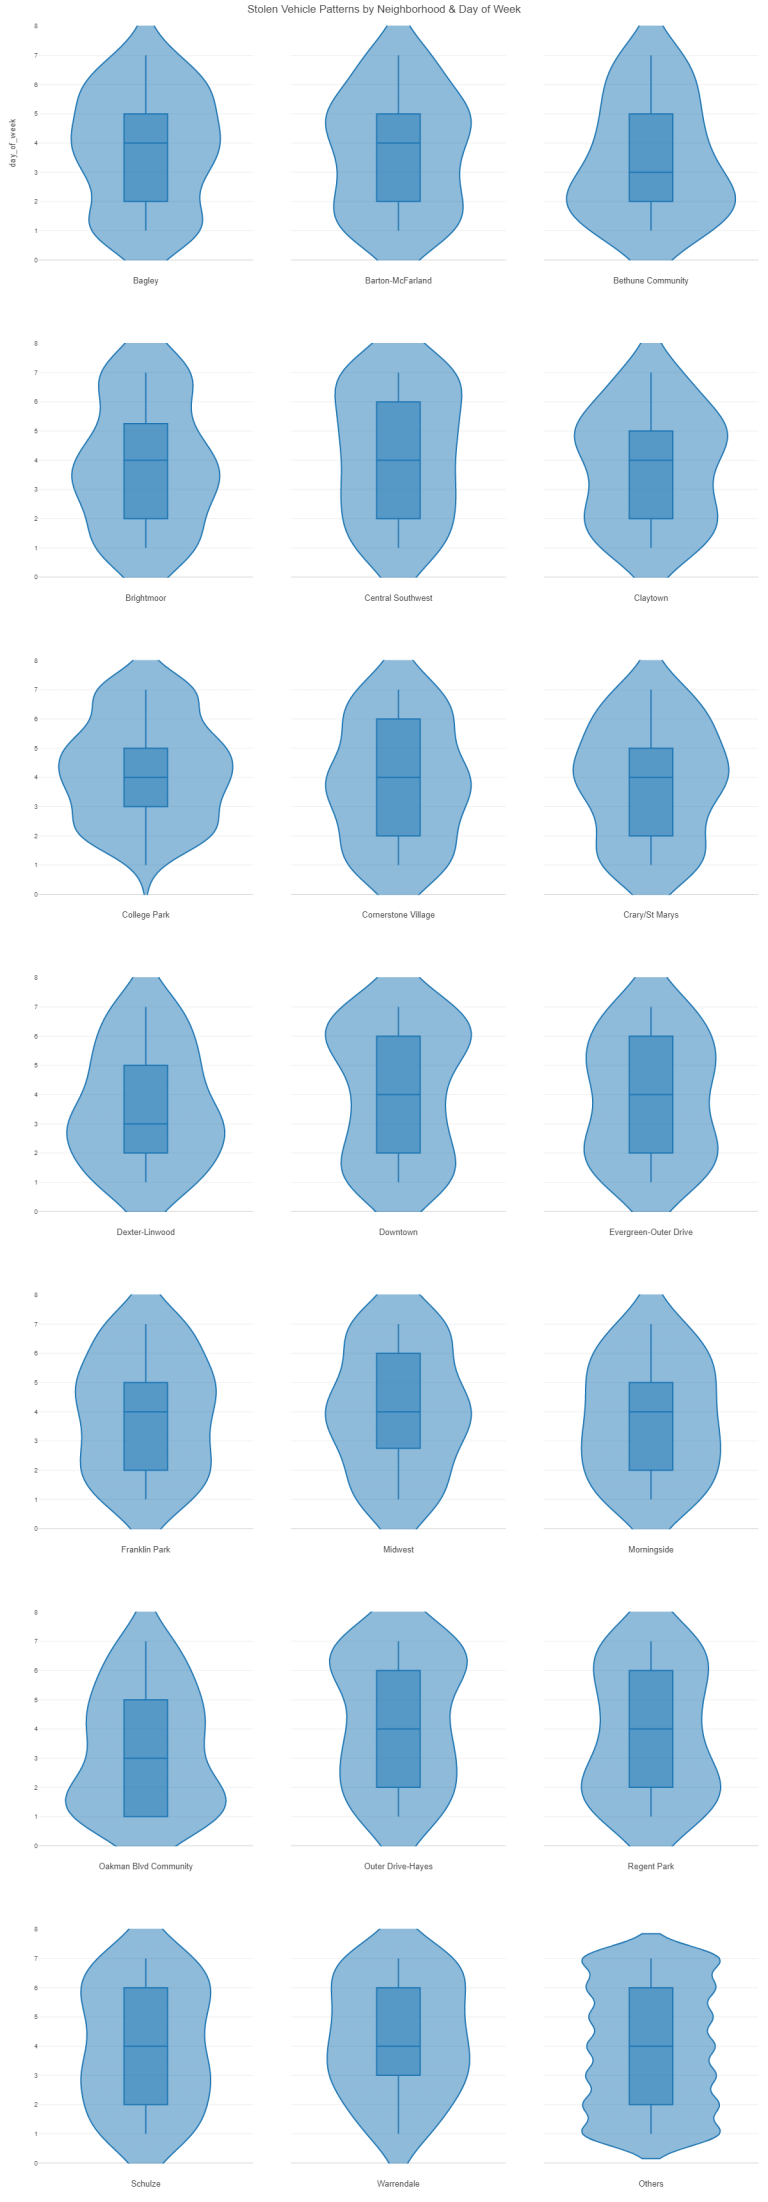
We don’t see a lot of differences here, other than perhaps downtown, where thefts tend to peak on Friday and Saturday (6 & 7 on the scale), quite understandable given the increased volume of activity generated by restaurants, bars, clubs, and other event venues. Simply put, there is much more opportunity, so some of the neighborhood activity may move downtown for the weekend.
How about the time of year? Is stolen vehicle activity more prevalent in the summer months, when more people are likely to be out and about? Or is Detroit’s climate not severe enough for the numbers to dip in the winter? We know when a polar vortex is in town that crime numbers drop, but these are infrequent events in Detroit. What do the numbers tell us about seasonality?
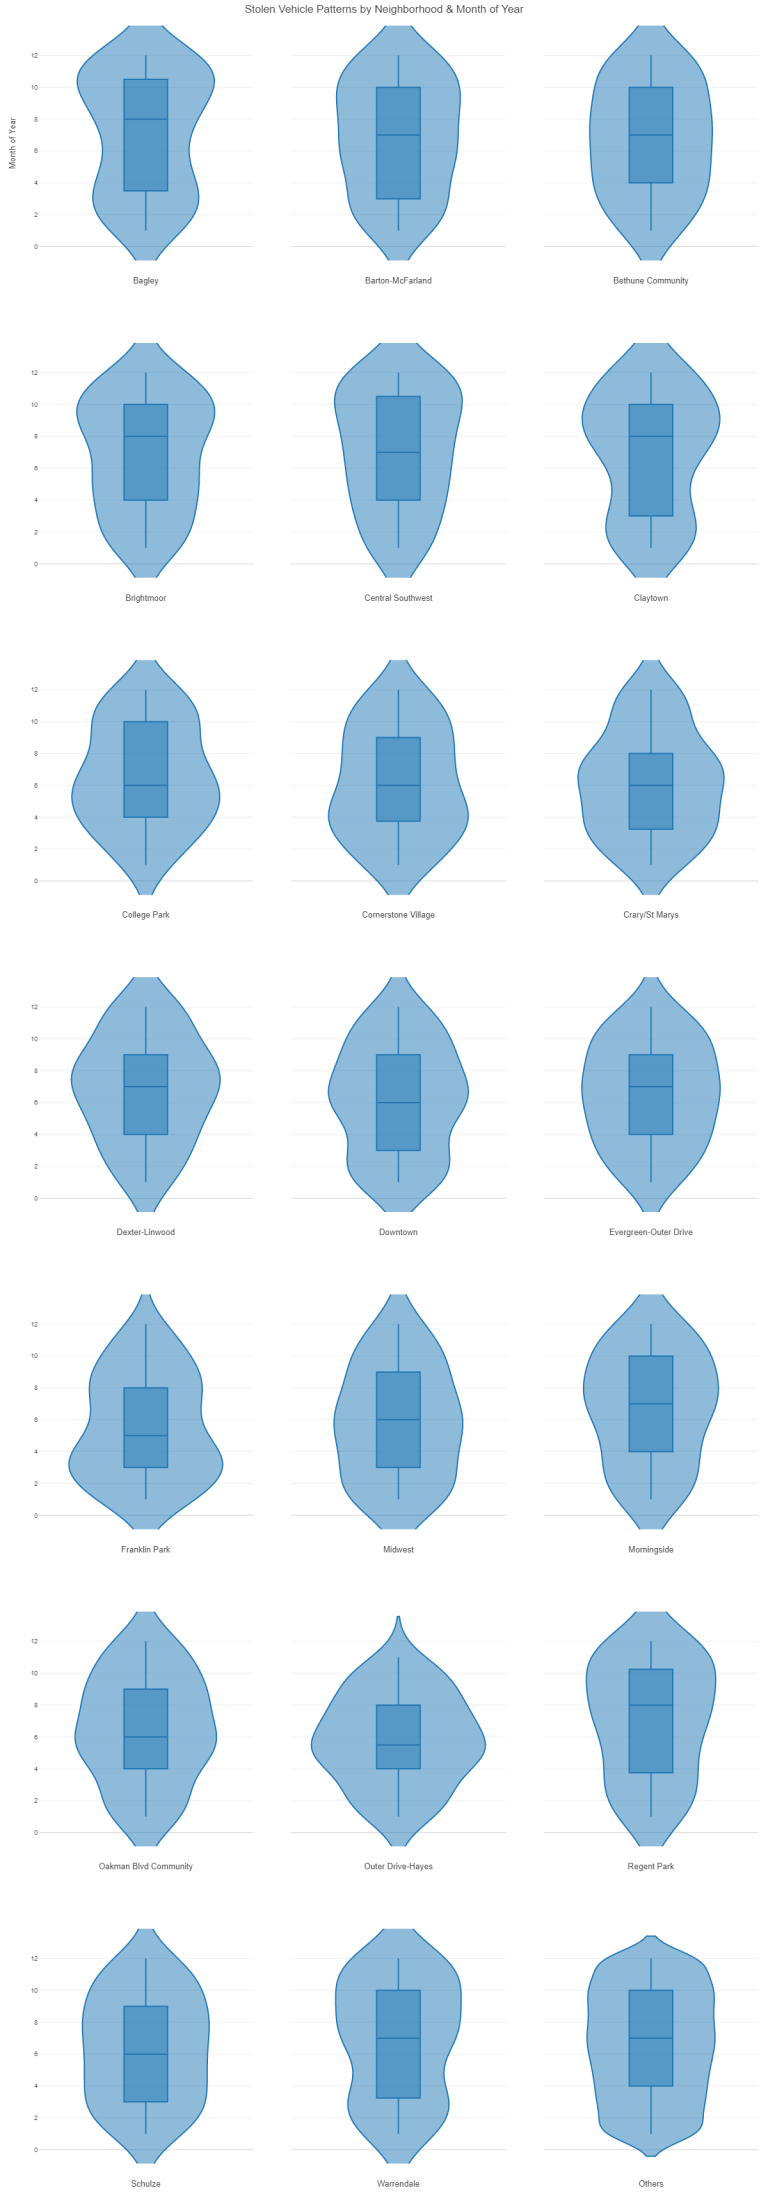
These plots are interesting – there seems to be no consistent bias toward the summer months, but it varies considerably by neighborhood. Downtown certainly shows it’s highest activity in the May-August (5 thru 8 on the plots) period, while others show a more uniform pattern (Schulze, Bethune Community). Overall, the plots suggest a bit higher level in the spring and summer months. To confirm this suspicion, let’s look at the seasonal patterns for the entire city:
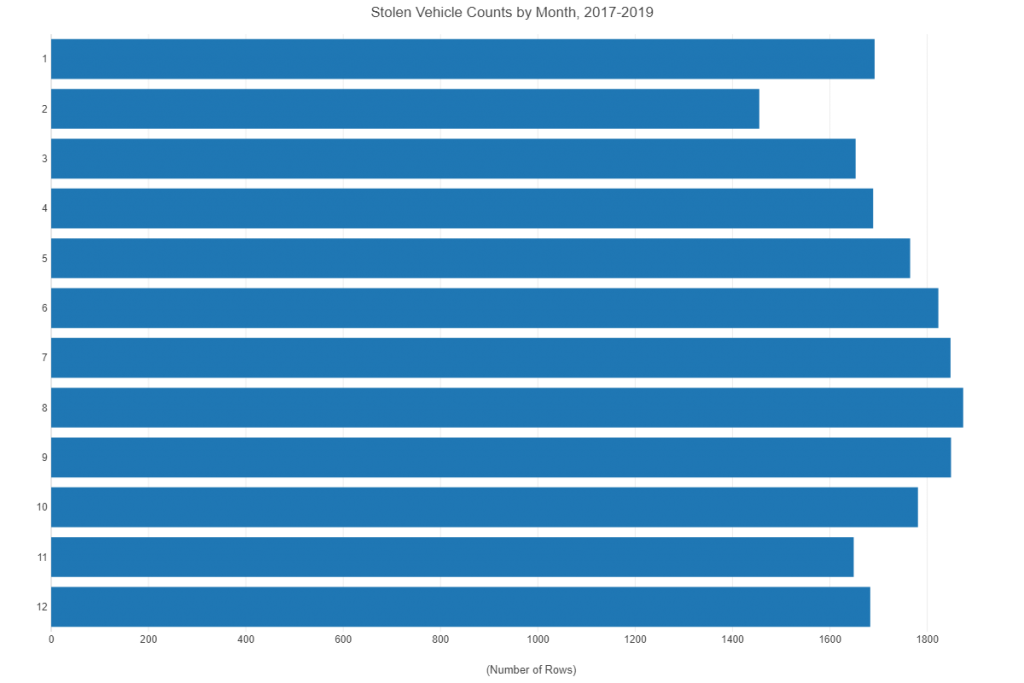
Here we can see that August (8 on the plot) is the peak month, followed closely by September, July, and June. However, the difference from peak months to quieter months is slim, aside from February, which has fewer days to commit a theft. So the pattern is very slightly seasonal, but perhaps less so than other categories of crime.
We’ve dealt with a lot of charts and numbers to this point; now is the time to put this all on some maps. This will enable us to dive deeper into where the thefts are happening, and inform us of major hot spots, assuming they exist. For our mapping, we’ll once again turn to Carto, where we take 3 different views of the same numbers. We’re providing the links to these maps, as they tell a more interesting story when viewed as live versions.
First up is a heatmap covering the entire period. This is designed to identify where the hot spots are for stolen vehicles, and should give us an initial understanding of the numbers. Recall our Top 5 neighborhoods from the first chart? Here’s a rough geographic look at them in the context of the entire city:
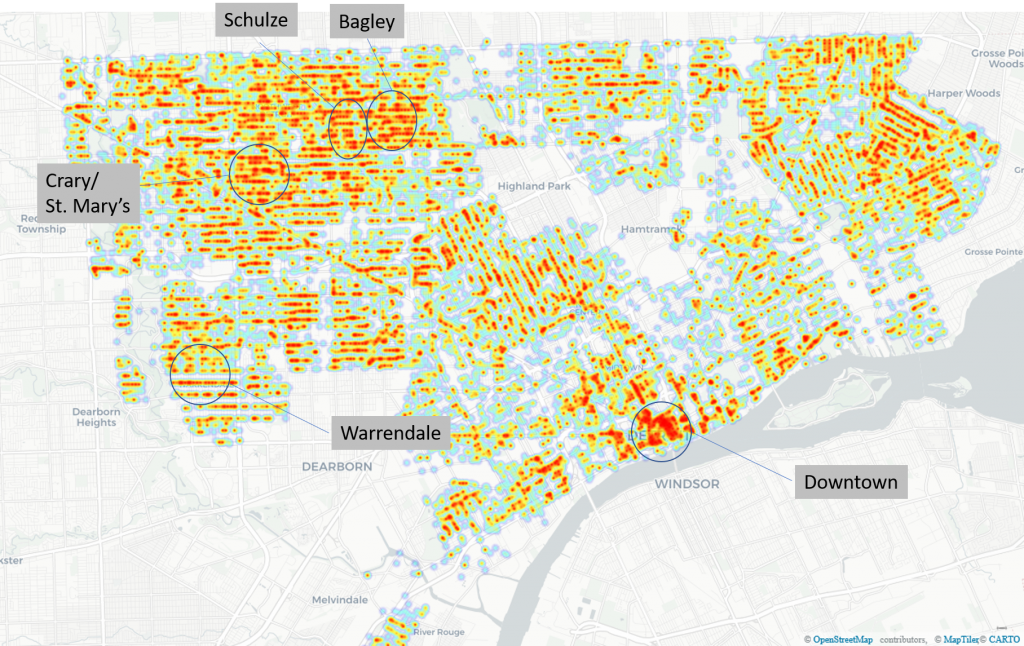
Now, here’s the live map showing those patterns, with the ability to zoom in to learn more:
https://kc2519.carto.com/viz/b5c55fe7-a1f9-4252-9862-3e856274921d/public_map
Another view similar to the heatmap is a cumulative map showing how these incidents build over time. This gives us the opportunity to see how patterns evolve, and potentially whether hot spots from 2017 are different from those in 2019, which a static heatmap might obscure. Here’s the live version:
https://kc2519.carto.com/viz/d8334949-f315-48bb-ae4c-e6ab1845ac90/public_map
Finally, we offer a map showing vehicle thefts at the monthly level, with prior events gradually fading. This type of map can certainly reveal recurring hot spots that may go dormant periodically, as well as highlight emerging areas that were absent from the early months on the map. Carto provides the ability to pause the map animation at various points in time, allowing viewers to understand changes in patterns.
https://kc2519.carto.com/viz/b98c2e07-8a60-4eb3-9221-f542e4979ac2/public_map
This has been my attempt to tell a visual story on vehicle theft in the D. Hope you enjoyed it, and thanks for reading. See you soon!