Let’s follow up my earlier post with a deeper dive into the 911 (emergency) call data from Detroit’s open data portal. We’ll be focused on the same 30 days of data and begin attempting to understand where the calls are originating – in total and then for a couple of specific call types. I’m hoping this will provide some insight into call patterns across the city.
Let’s start by aggregating the data in Exploratory; recall that the data we used previously is at a call level, which is great for seeing individual points on a map, but not so good for many chart types. The goal here is to provide data for a Flourish sunburst chart where we can see hierarchical data levels for each Detroit neighborhood and call type. Here’s a snapshot of our data:
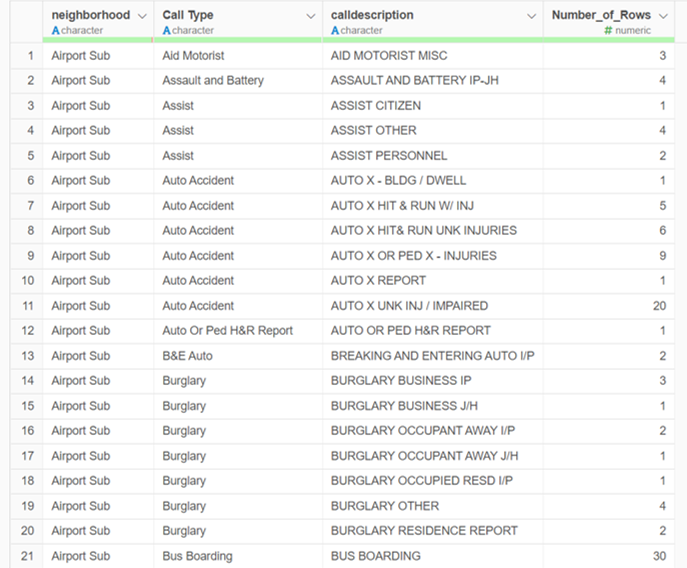
You can see how call descriptions related to burglary have been rolled up to a higher level call type for more efficient analysis. I have used a series of case statements in Exploratory to consolidate some of the many call descriptions into more meaningful aggregate call types. You’ll see how this becomes useful visually in a moment.
After uploading this data to Flourish, we can build the sunburst chart, which defaults to all neighborhoods. Use the dropdown list to see individual neighborhoods, where the data is more manageable.
We now have the ability to see which call types are most prevalent for each neighborhood; also, note how the hierarchy extends to the call description level for further detail. In our prior example of burglary data from the Airport Sub neighborhood, you can now see several burglary type calls on the outer ring of the sunburst; clicking on the Burglary type will filter using only these call descriptions. Thus, we are able to get a clear picture at the lowest data level. Hover over a description to see the details.
The sunburst chart is great for this sort of data exploration, but it isn’t as effective at comparing neighborhoods, since we are viewing each one individually. To extend our visual analysis, I’ll turn to CARTO, where we can map the neighborhoods as polygons. To do this I merge two different source files, one with the polygon boundaries, the other with the aggregate data. Here’s some simple SQL code in CARTO:
SELECT n.the_geom, n2.nhood_name AS Neighborhood, SUM(n2.number_of_rows) AS Calls
FROM neighborhoods n
INNER JOIN current_city_of_detroit_neighborhoods_join_1 n2
ON n.nhood_name = n2.nhood_name
GROUP BY n.the_geom, n2.nhood_name
I’m simply joining the two data sources on nhood_name (neighborhood); we can also use a WHERE clause to extract specific call types. We’ll then use a choropleth map in CARTO to show by color where the highest and lowest levels of calls are originating. Here’s our result for all types of calls – zoom in or drag the map to get closer looks:
It’s pretty clear that the Downtown and Midtown neighborhoods in the lower center of the map have the highest call volumes. These areas are home to many clubs, sports venues, restaurants, bars, and elevated levels of visitor traffic. Let’s see if anything changes when we select a single call type – Shots Fired:
Big changes here! Fortunately, the Downtown and Midtown areas have very low rates for these calls, while less densely populated areas on the far east and far west sides show high activity levels. Finally, we’ll look at the broad call type of Disturbance:
Now we see a more dispersed pattern, where Downtown and Midtown have plenty of calls, but are joined by a number of neighborhoods from across the city. These numbers may reflect some local hotspots where trouble occurs on street corners, outside of bars, or perhaps due to house parties. All speculative, since we can’t see the police reports.
That’s it for now; we could spend days investigating this data, but don’t have that luxury. I hope this was useful in showing how we can quickly analyze a dataset using some basic charts and maps. Thanks for reading!