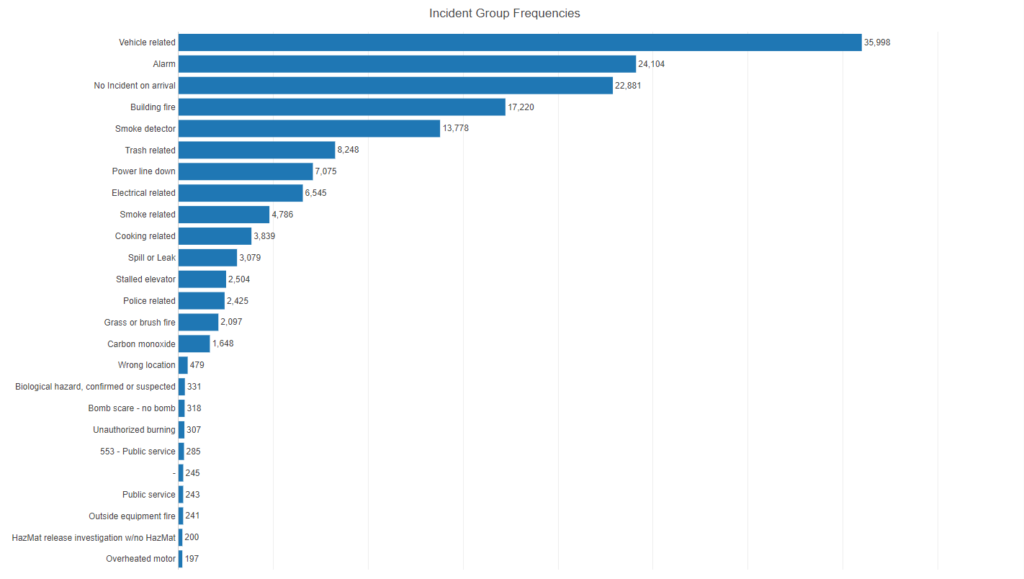
In my previous post, we saw that vehicle related incidents created more call volume than any other call types. As a refresher, here are the 2017-2023 aggregate volumes:
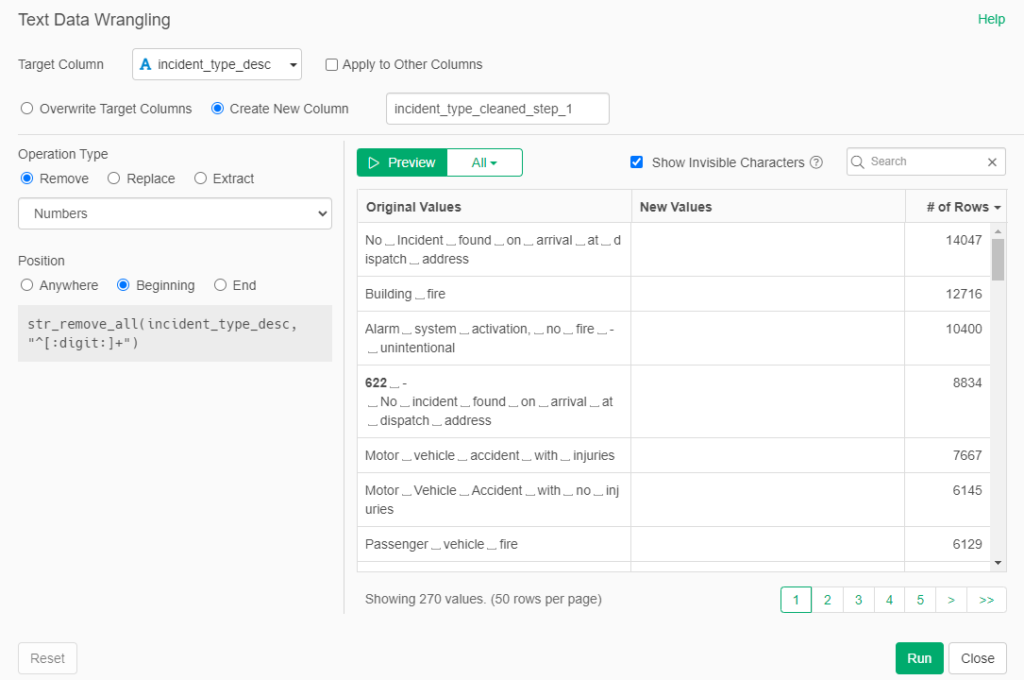
In this post I’ll drill down one layer to see the specific vehicle calls driving the numbers. Before I get there we need to clean the data just a bit, using a few simple steps in Exploratory. Our first step is to remove the numbers used to categorize incidents as these give us multiple instances of related data (probably related to reclassifying the data over time). See Row 1 and Row 4 below for an example:
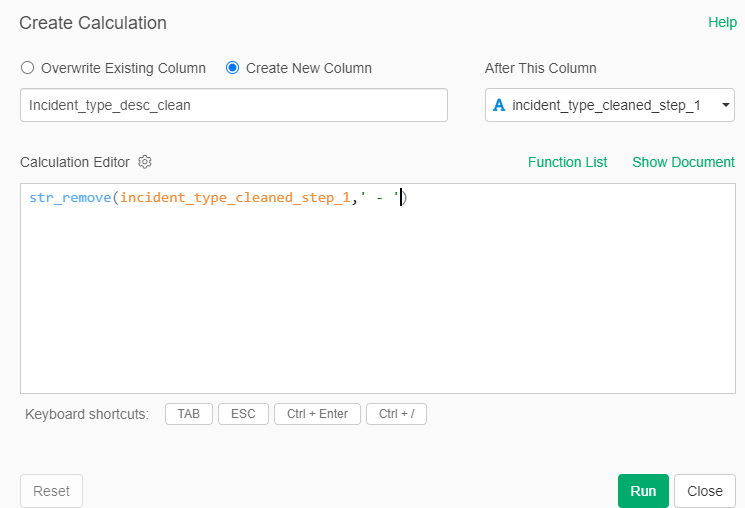
A second step is to remove the spaces and hyphen that surrounded the numbers:
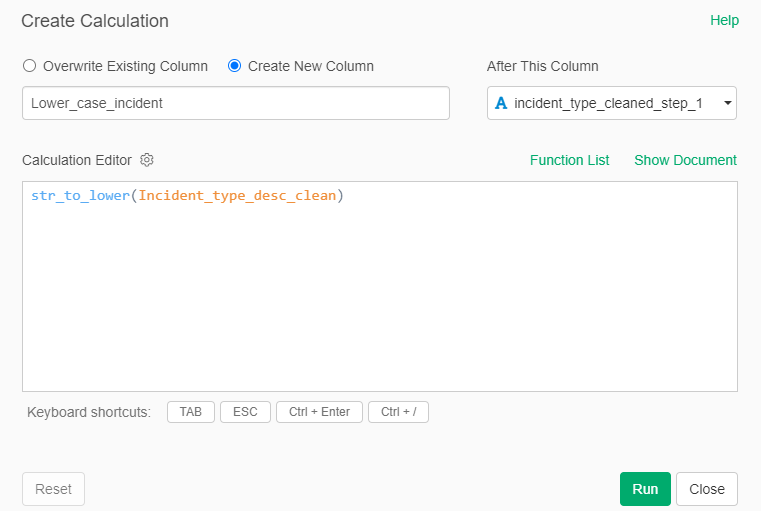
Our third step is to convert all entries to lower case so they will be seen as a single category:
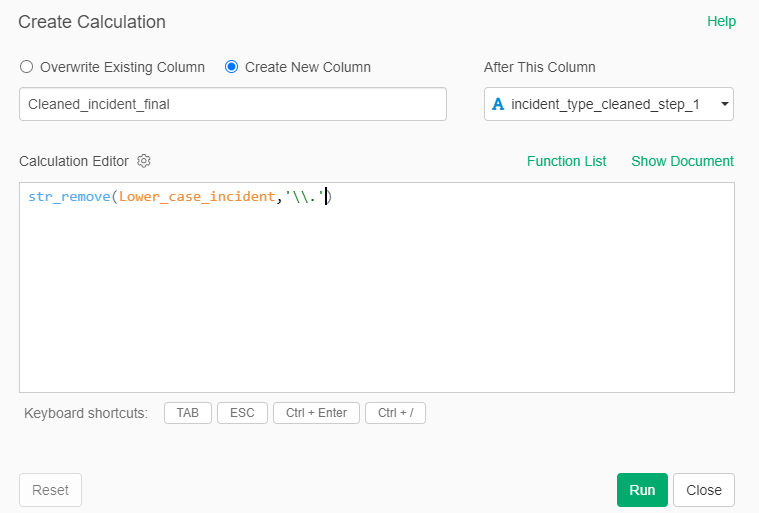
Finally, we remove any periods – I discovered this one after a bit of scratching my head!
Finally, we have a clean dataset with accurate numbers we can visualize. As I’ve noted before, data analysts often spend a great deal of time on the wrangling and cleansing of data, as most data sets are less than perfect. In any case, we can now see the components of vehicle related incident numbers:
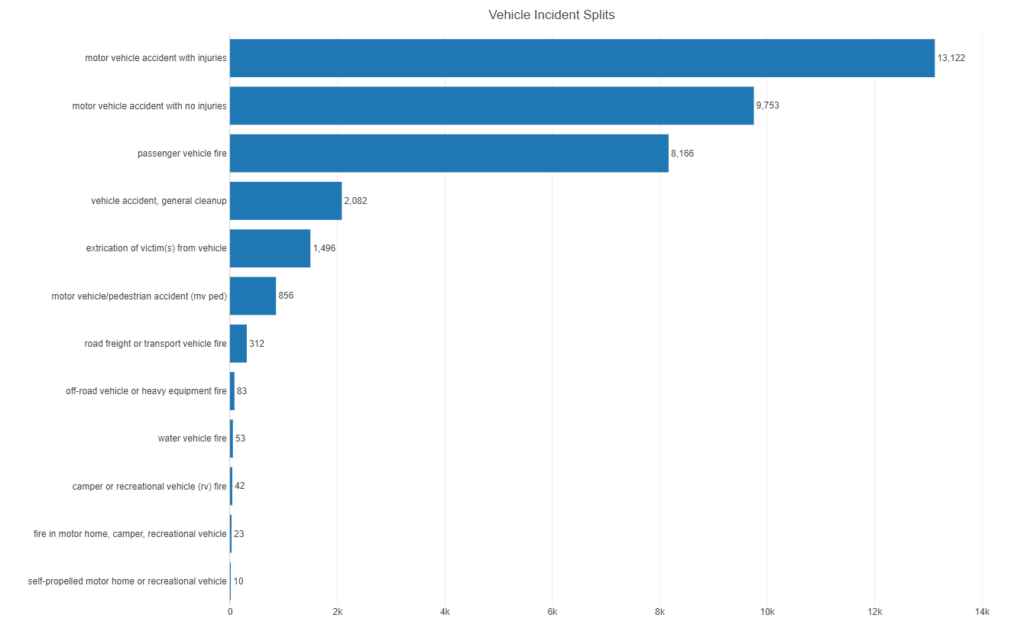
Three types dominate the numbers – accidents with or without injuries plus a serious number of passenger vehicle fires. Together, these account for about 31k of the 36k calls on the chart – 86% of the total. Fire crews are spending a significant proportion of their time in responding to vehicle incidents. We are indeed the Motor City!
An interesting question we can address is whether these numbers have changed over time. Evidence shows that some cities have seen a major uptick in vehicle accidents since 2020. Is this true for Detroit as well? Let’s have a look at the monthly trend for vehicle related incidents:
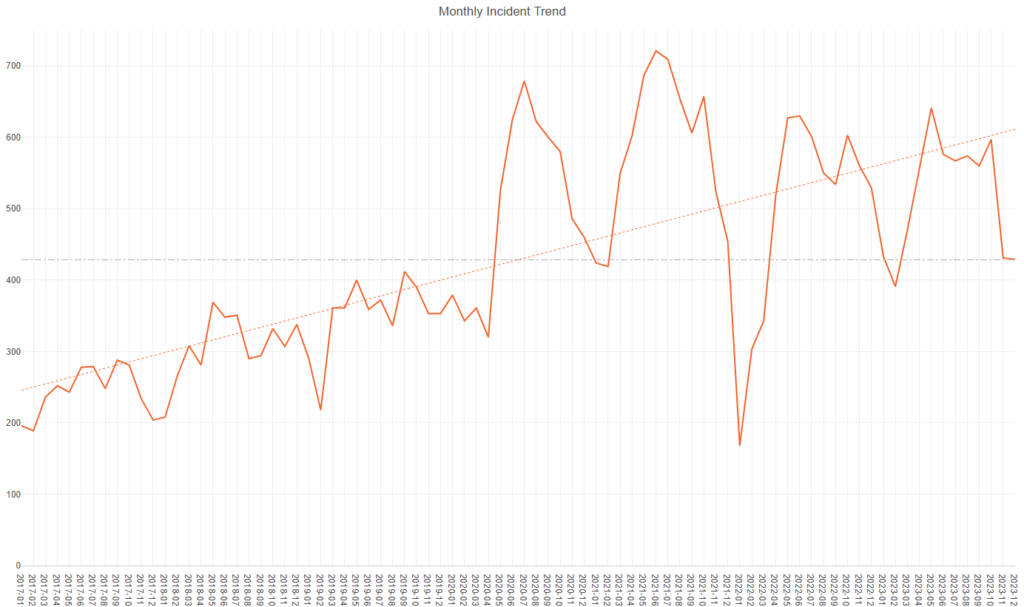
Indeed, there has been a rather alarming increase in vehicle related incidents, from the 200-300 range in 2017, to a new normal between 400 and 700 per month since mid-2020 (excepting the data collection issue in early 2022). What changed? Some will cite COVID-19 and the change to traditional traffic patterns (fewer commuters, empty roads encouraging reckless driving), but the real inflection point is May 2020, coinciding with George Floyd and subsequent protests. There is significant evidence that this was a turning point for both reckless driving and less willingness from police to enforce vehicle violations during the COVID-19 window. Based on the above chart, my belief is that accidents were the main driver of the trend. Let’s see if the data supports that hypothesis:
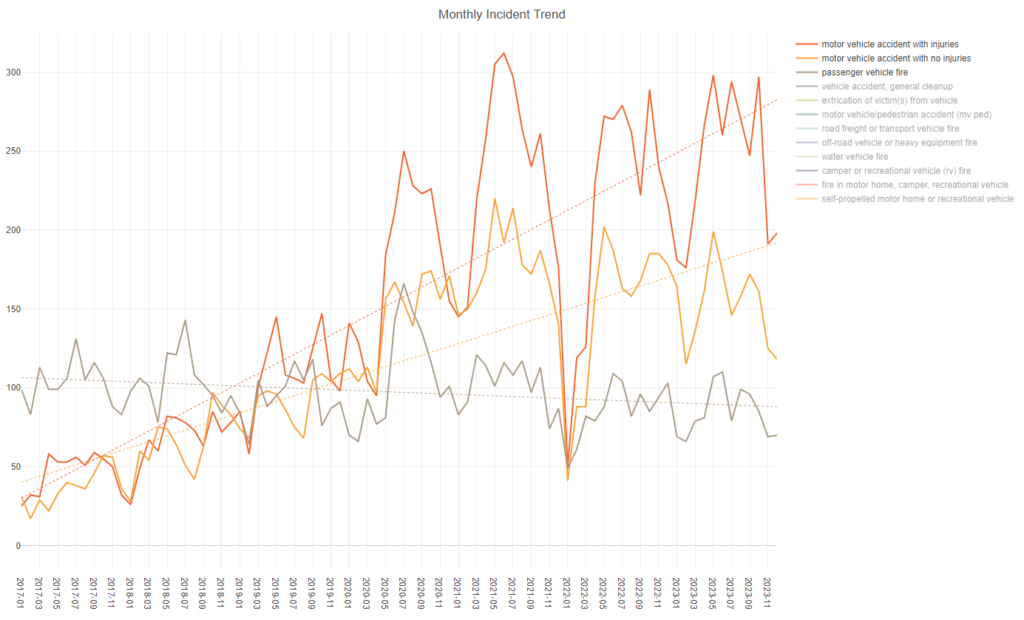
The change here is even more pronounced – passenger vehicle fire incidents have actually dropped slightly, while accidents have skyrocketed. Injury accidents were essentially equal in volume to non-injury accidents in 2017-2018. Since 2020 they have reached new levels while showing no sign of returning to earlier levels. If you drive often in Detroit, you would suspect that something has changed; here is the evidence that reckless driving resulting in accidents has in fact increased dramatically.
With this bit of sobering reality, I’ll wrap up this post. My next post in the series will examine response times, by incident types as well as over time. As always, thanks for reading!