My previous post in this series took an initial look at Detroit listing prices from 2017-2023, using data from the Realtor.com website. In this post we’ll dive deeper into the zip code level to gain a greater understanding of the market. Once again, I’ll be using Exploratory for all the data exploration and visualization.
The first few charts I’ll share are known as violin plots (or guitar plots). These charts are adept at displaying the range, median (50th percentile), and frequency of values; for example, the average monthly listing price from low to high coupled with how often those values occur. Let’s present our first zip code level chart which examines the monthly average sales price:

A couple quick observations here – first, the 48226 and 48201 zip codes have much higher average price ranges compared to all other areas. Second, we can see that most zip codes have a very small range to their listing values, sitting in the $0 to $100k range. To understand further what we are viewing, let’s look at the highest and lowest value zip codes. First, the 48226 zip code, which covers the core downtown area which has recently been adding high end real estate, typically in the form of high rise condominiums.
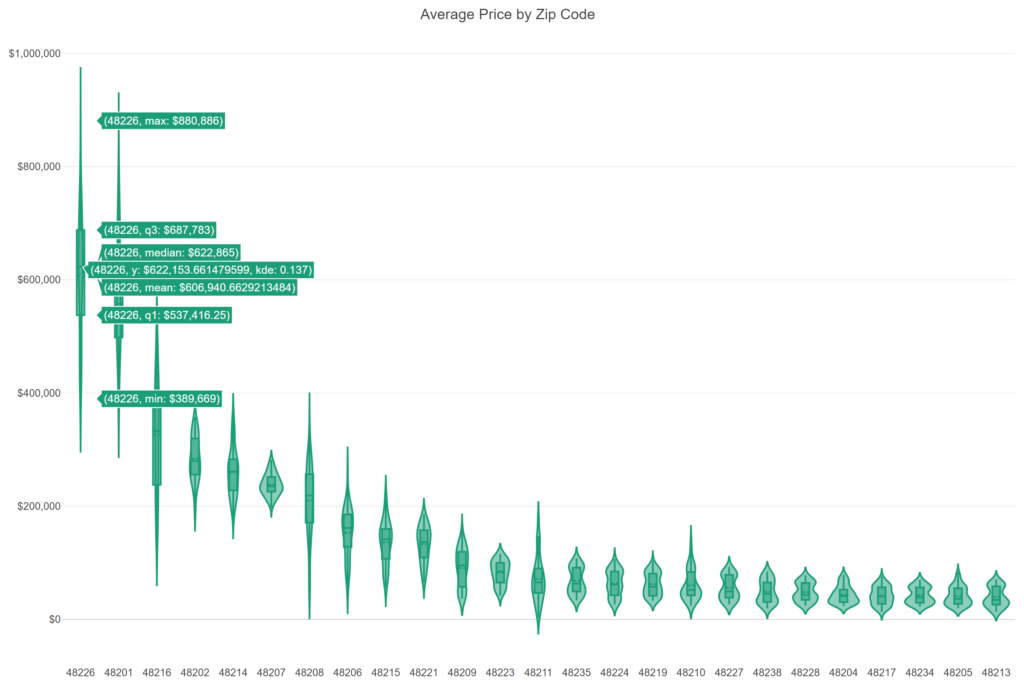
Here we can see that the median monthly listing price sits slightly above $622k, with the mean (average) at nearly $607k. The lowest month (min) is just under $390k, and the highest month (max) is above $880k. Other metrics include the Q1 level (25th percentile) and the Q3 level (75th percentile). The range of values here is large, due perhaps to small monthly volumes coupled with increasing price points over our 90 month window. Now let’s turn our attention to the 48213 zip code, representing a more desolate patch of Detroit’s eastside.
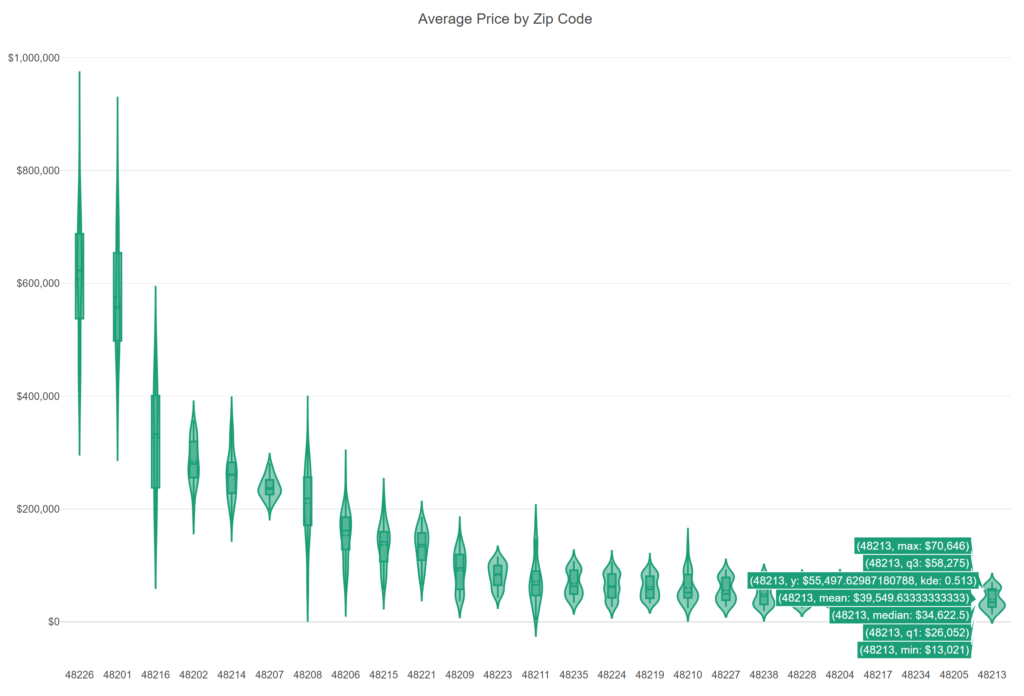
The distribution here is much tighter, an indication that there are few (if any) high end properties in the zip code. The median value is just under $35k, with the mean below $40k. In one month, the average price was as low as $13k, although we do see a high at greater than $70k. Perhaps prices are starting to climb, but they remain very low relative to the 48226, 48201, and a few other areas.
Let’s turn our attention now to the number of listings:
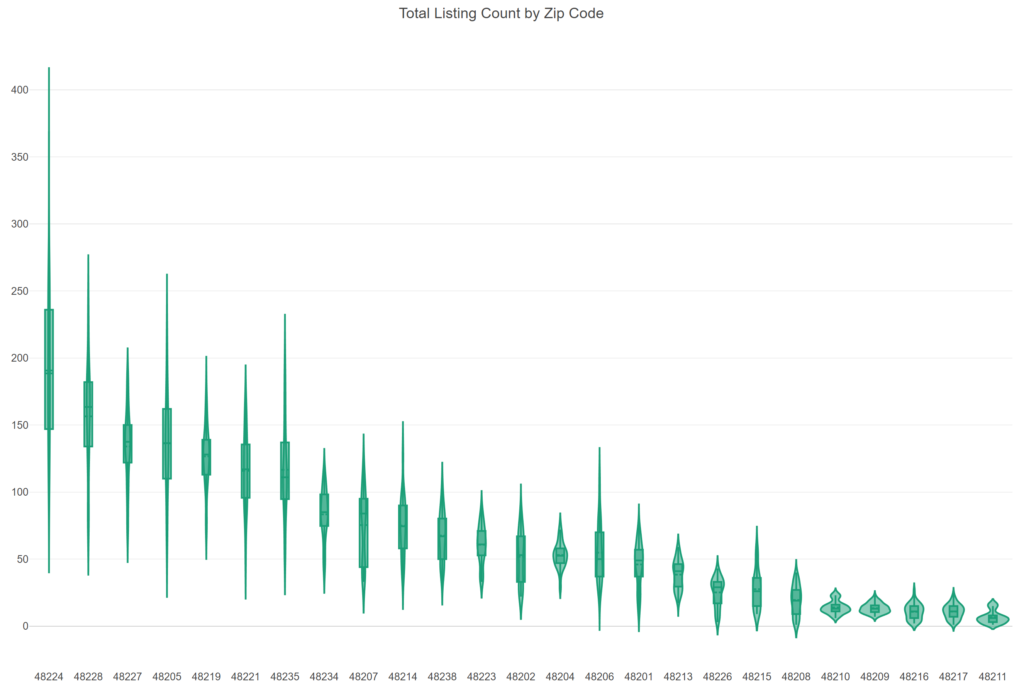
Interestingly, we see the 48226 and 48213 zip codes side by side toward the lower end of listing volumes. The 48213 has a monthly median of 41 listings while the 48226 has a median of just 29 listings. This affirms my earlier thought about the large price variance for 48226; a few very high end listings can really shift the average price for a month.
Let’s check on the number of days a listing is on the market prior to selling:
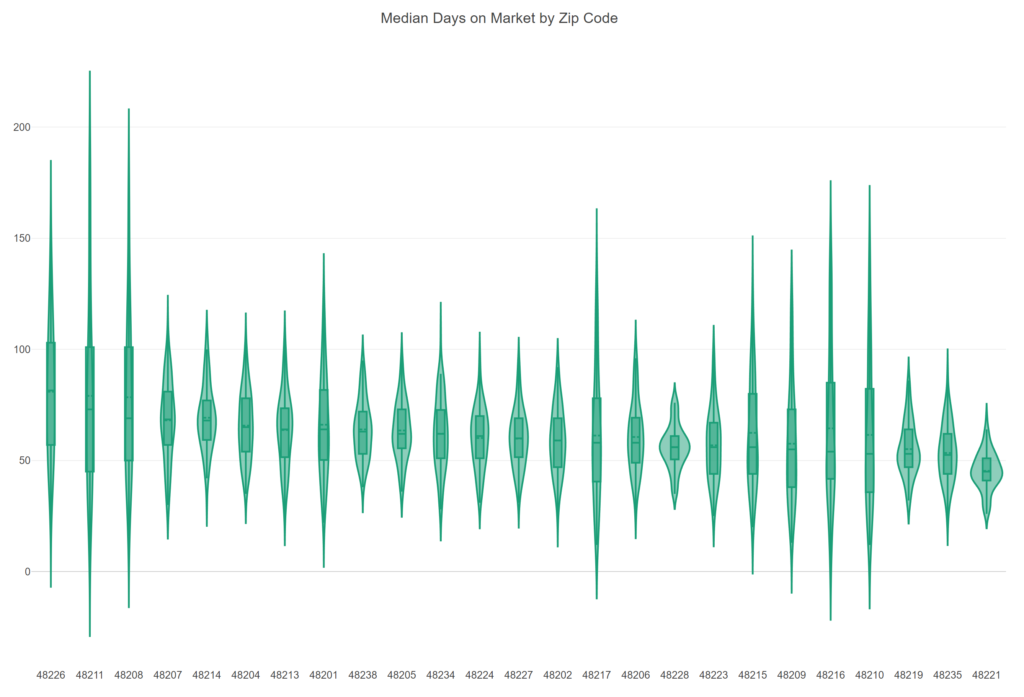
No surprise here – 48226 properties are the slowest movers on average, but 48213 properties also move slowly, for entirely different reasons. Let’s view some specifics:
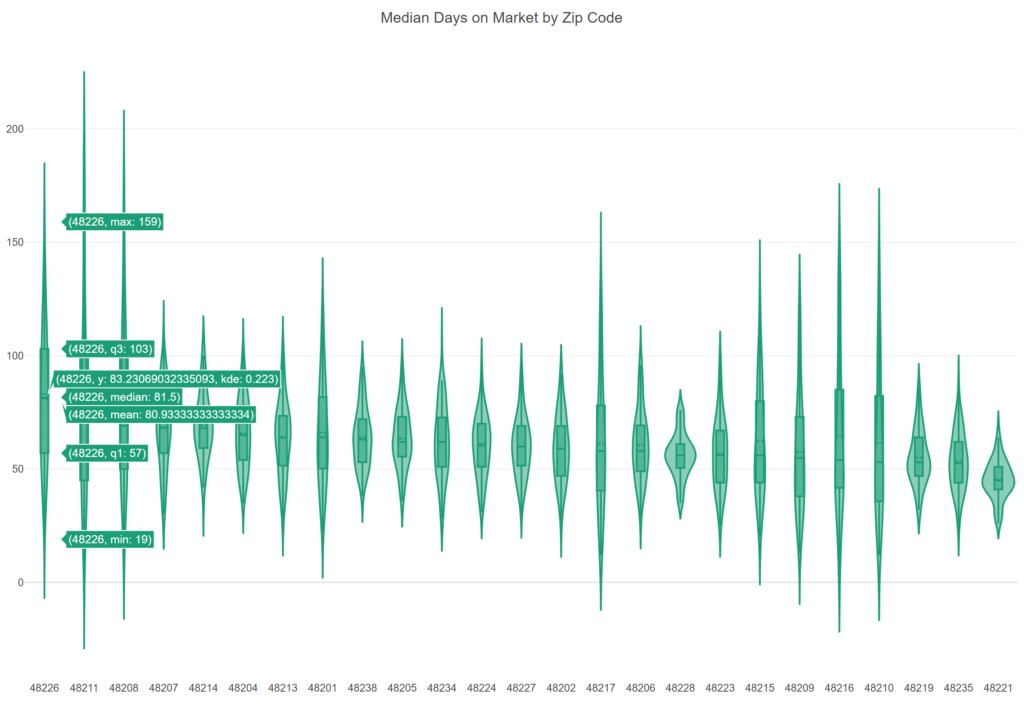
Both the mean and median are at 81 days on the market, although 25% of the time the listings average 103 days or greater (Q3 = 103). How about in the 48213?
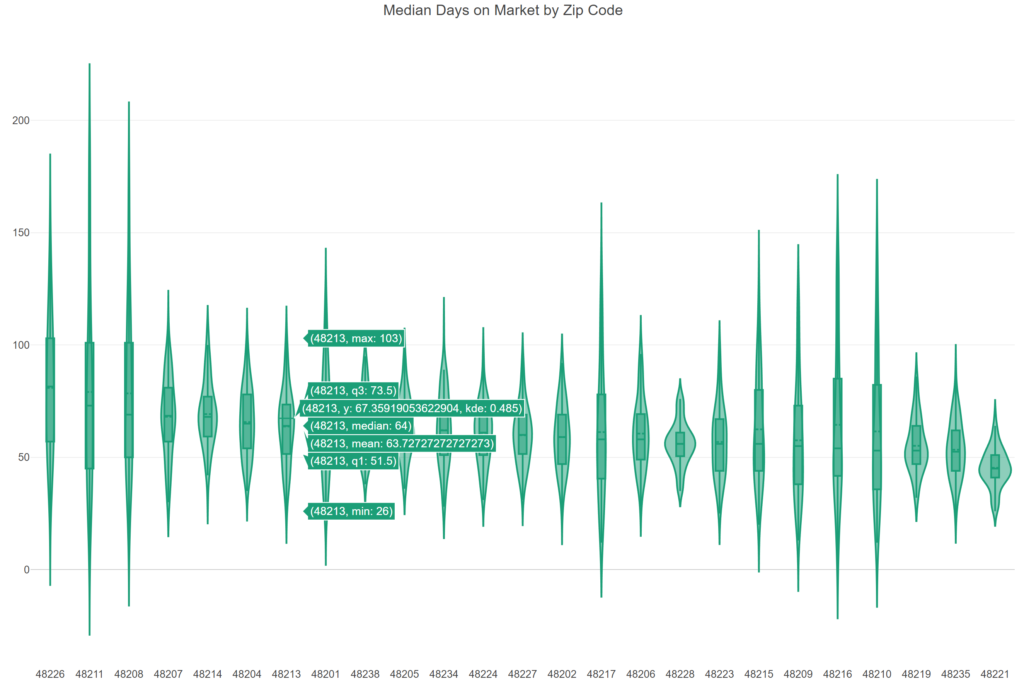
In the 48213, 64 days is the midpoint for listings; just 25% of the time does the number exceed 73.5 days. This is a fairly tight, consistent pattern compared with most zip codes on the chart. The low price points may ensure a relatively steady sales pattern.
We’re going to shift to square footage of listings to close out this post. Here is a look, sorted by the median square footage:
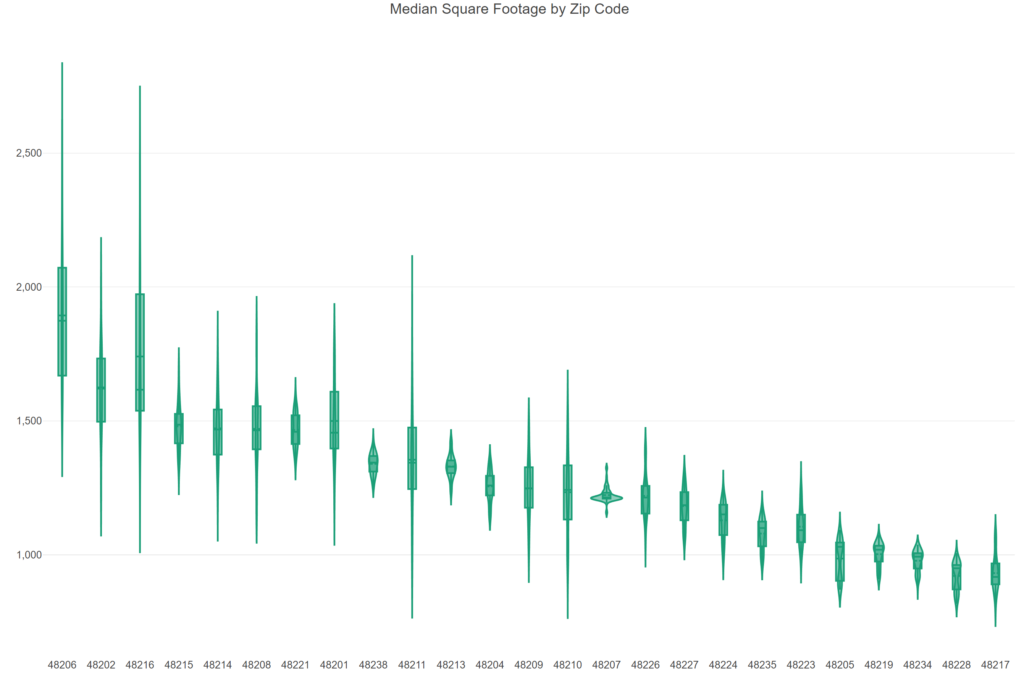
At the high end is the 48206 zip code, with a median value of 1,874 square feet. This neighborhood is located on Detroit’s near westside, and contains a lot of substantial sized multiple story properties. At the opposite end is the 48217 neighborhood (with many single level or bungalow properties) in the far southwest edge of the city, with a median size of just 917 square feet. Our 48213 and 48226 zips are both in the middle of the size range, at 1,329 and 1,214 square feet, respectively.
Does square footage correlate with higher prices? The quick answer is yes, but it’s not a strong correlation:
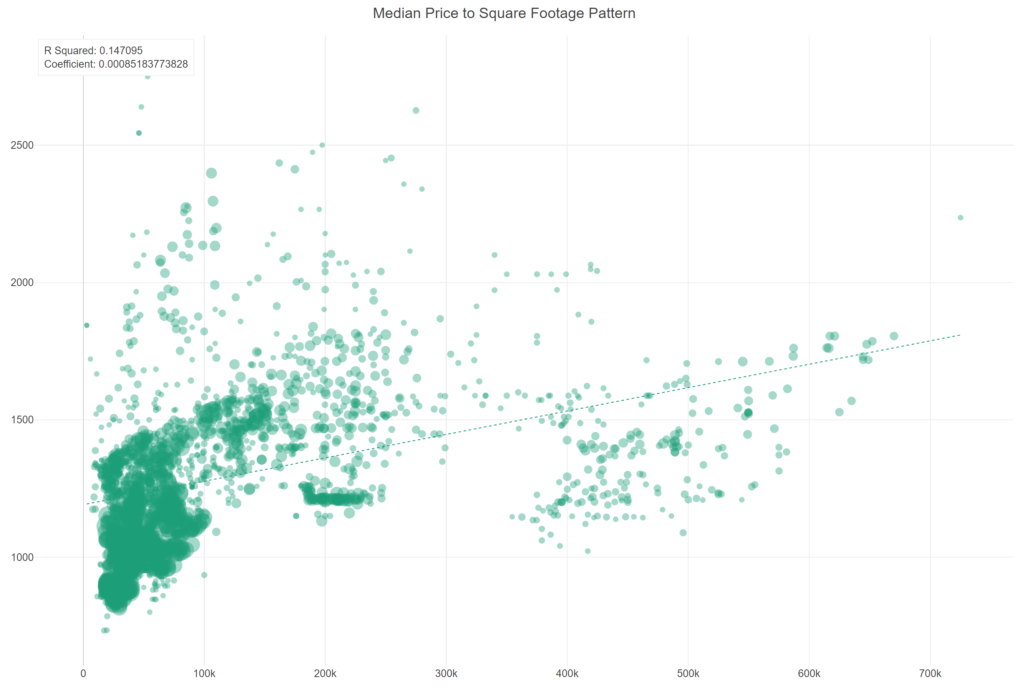
We have an R squared value just under .15; on a scale from 0 to 1, we can explain about 15% of median listing prices by using median square footage. We can see many examples where the relationship is not perfect – plenty of large houses at low price points (upper left corner) and smaller properties at high price points (bottom center) as we saw from the 48226 data.
That’s a wrap for this post; I’m looking at building a Detroit housing dashboard soon that will allow for opportunities for everyone to explore the data. Thanks for reading!