Most Americans seem to have a myopic set of views when it comes to slavery, believing that it only existed in the US, and was eradicated forever by President Lincoln and the Civil War. Each of these beliefs is not remotely true; slavery goes back thousands of years, and has existed on all populated continents, and it continues today to varying degrees across the world. The organization Walk Free monitors modern slavery activity and it’s related risks and outcomes. In this post I’ll be using their most recent data to visually document this ongoing issue.
Modern slavery can exist in a variety of forms, ranging from forced child labor to sex trafficking, and can be found in countries large and small around the globe. Here’s an explanation from the Walk Free site:
Modern slavery covers a set of specific legal concepts including forced labour, debt bondage, forced marriage, slavery and slavery-like practices, and human trafficking. Although modern slavery is not defined in law, it is used as an umbrella term that focuses attention on commonalities across these legal concepts.
Walk Free at walkfree.org
I’ll be using Exploratory to analyze and visualize this information in an effort to identify and draw attention to troubling patterns with the hope of educating readers and expanding their awareness of this ongoing problem. Let’s begin with a look at the variables in the Walk Free data, to better understand what we can visualize effectively. Here’s a quick list of the data variables:
- Country
- Population
- Region
- Estimated prevalence of modern slavery per 1,000 population
- Estimated number of people in modern slavery
- Governance issues
- Lack of basic needs
- Inequality
- Disenfranchised groups
- Effects of conflict
- Total Vulnerability score (%)
- Survivors of slavery are identified and supported to exit and remain out of modern slavery (%)
- Criminal justice mechanisms function effectively to prevent modern slavery (%)
- Coordination occurs at the national and regional level and across borders, and governments are held to account for their response (%)
- Risk factors, such as attitudes, social␣systems, and institutions that enable modern slavery are addressed␣(%)
- Government and business stop sourcing goods and services produced by forced labour (%)
- Government response total (%)
This data provides the opportunity to map many of the categories, given the inclusion of region and country variables. This should help us to quickly identify the most troubling areas for a number of measures. Note that not all measures are available for every country, but there is certainly enough data to be able to tell the often grim story of modern slavery.
I’ll begin with some measures aggregated to the region level; these numbers are simple averages of the countries within each region.
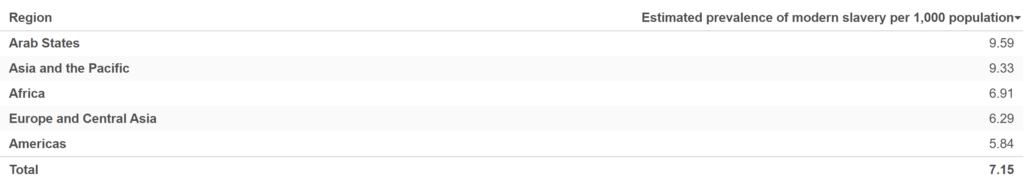
The overall number globally is estimated to be just over 7 persons per 1,000 living in some form of modern slavery, with the individual regions averaging between 5 and 10 persons per 1,000. The range of the values is lower than one might expect; we’ll learn more when we dive into the individual country numbers.
Next, we can examine the Total Vulnerability score, which shows a much greater spread by region:
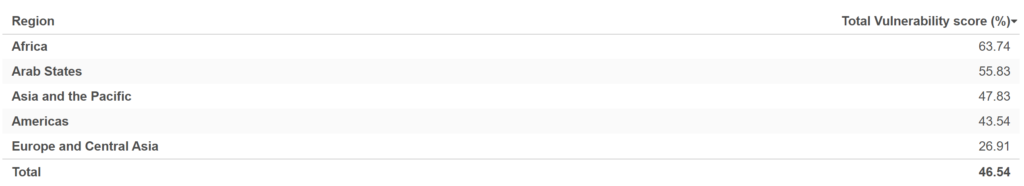
These numbers can be used to see where people are at the greatest risk of falling into modern slavery; Africa and the Arab States clearly have higher risk levels for their residents relative to Europe and Central Asia. Let’s examine one more variable at the region level – the usefulness of the criminal justice systems in combatting this issue.
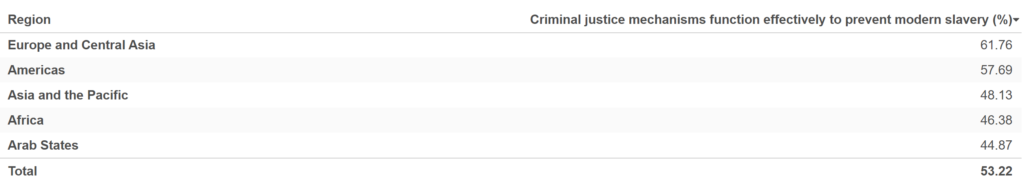
Higher is better for this measure, so we see nearly the reverse ranking compared to the prior table. Europe and Central Asia appear more serious (on average) about addressing modern slavery through legal means, although the overall level of effectiveness is not especially high. I suspect to see some very significant variation at the country level for this metric.
Let’s return to the prevalence score, but now at the country level. I’m going to limit the results (for now) to countries with populations greater than 20 million people. This will aid us in seeing patterns without an excess of data points. We can easily examine smaller countries in subsequent charts if we choose to do so. I’m going to employ a scatter plot, so I can see the population of each country as well as use color to identify the region. This may help us to identify some patterns:
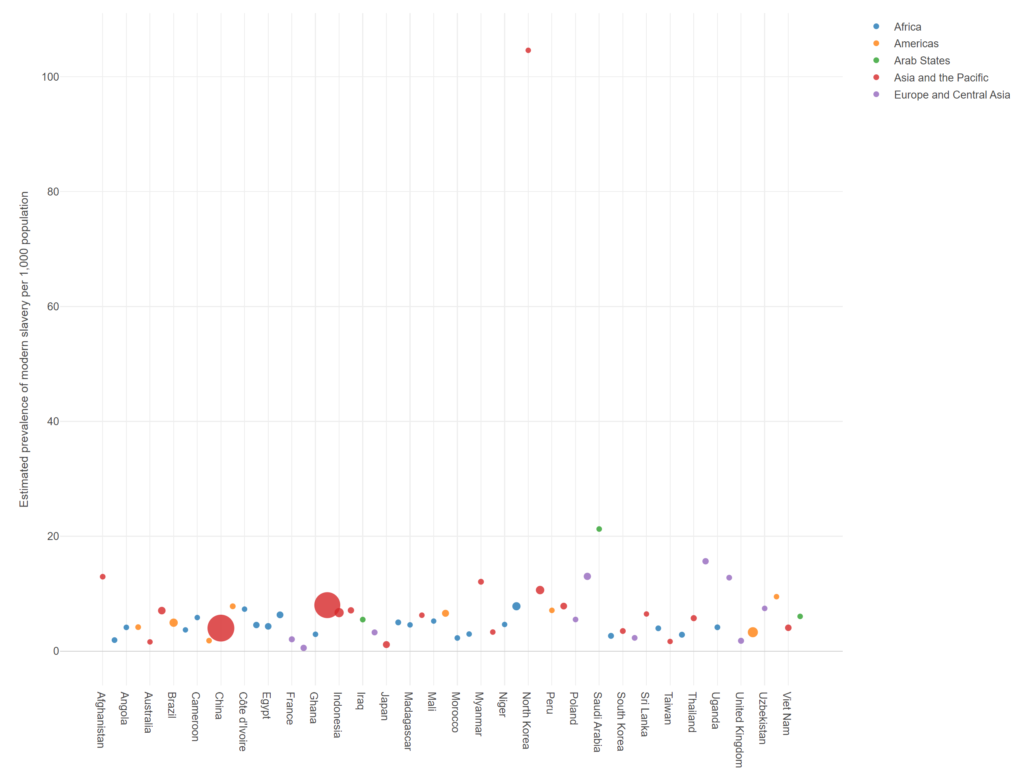
Why are the data values so compressed at the bottom of the chart? Notice the single data point with a score > 100 at the very top. This is North Korea, where more than 10% (104 per 1,000) of the population is considered to be in modern slavery. This is a dramatic outlier that prevents us from seeing the remaining data clearly, so let’s filter them out. Now:
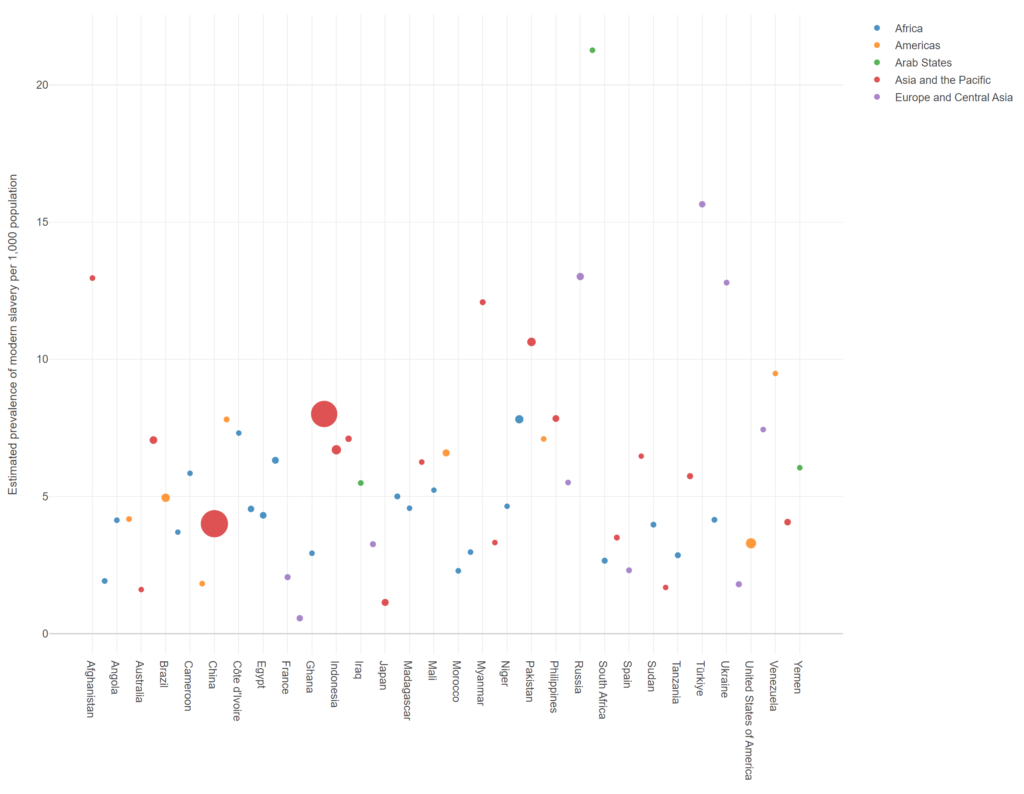
Much better! We still aren’t showing all the country labels, although we can easily hover on each value in Exploratory to overcome that limitation. We now see two countries with values greater than 15 per 1,000 – Saudi Arabia at 21.3 and Turkey at 15.6. We can also see just how large the populations of China and India are relative to other countries (the two large red circles), but they are otherwise similar to the many smaller countries in terms of prevalence.
Let’s have a look at another scatter plot, this time focusing on the justice systems within each country. Which countries appear to take modern slavery seriously, based on their effectiveness fighting the issue via the legal system?
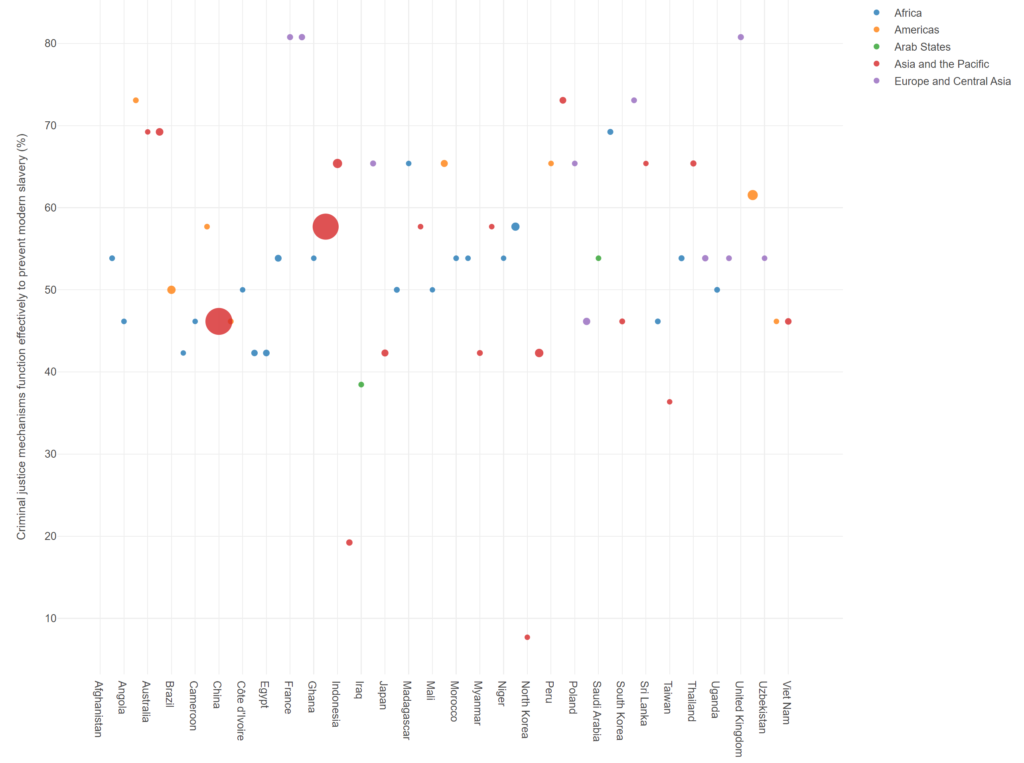
Three countries (of our > 20 million population segment) score above 80% on this metric – France, Germany, and the United Kingdom. The United States is considerably lower, at 61.5%, with India (57.7%) and China (46.1%) further behind. The two nations with appallingly low scores are Iran (19.2%) and North Korea (7.7%). There is little hope in those countries for justice system interventions to mitigate modern slavery.
Let’s turn to a few maps to explore the data further. We’ll continue with the justice systems we just shared via scatter plot, and then return to the prevalence and vulnerability metrics. Here’s how things look on a world map:
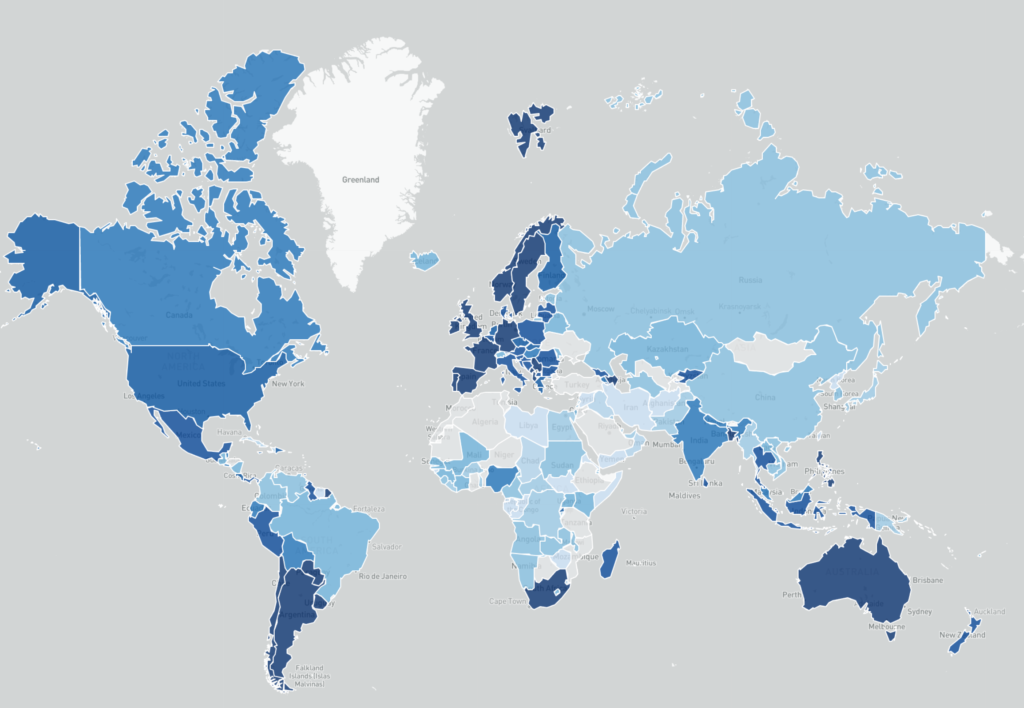
In this map, darker shades of blue represent more effective justice systems; as an example, Australia in the lower right has a score of 69.2%; most of Western Europe is similarly colored. In contrast, we see a lot of light blue (gray indicates missing data) in Africa, where many countries have scores below 50%. Both the US and Canada score closer to 60%, indicating some gaps in their justice systems ability to effectively combat modern slavery issues.
Next we’ll examine vulnerability scores at the country level. In this case, darker shades are a negative marker, indicating populations at greater risk.
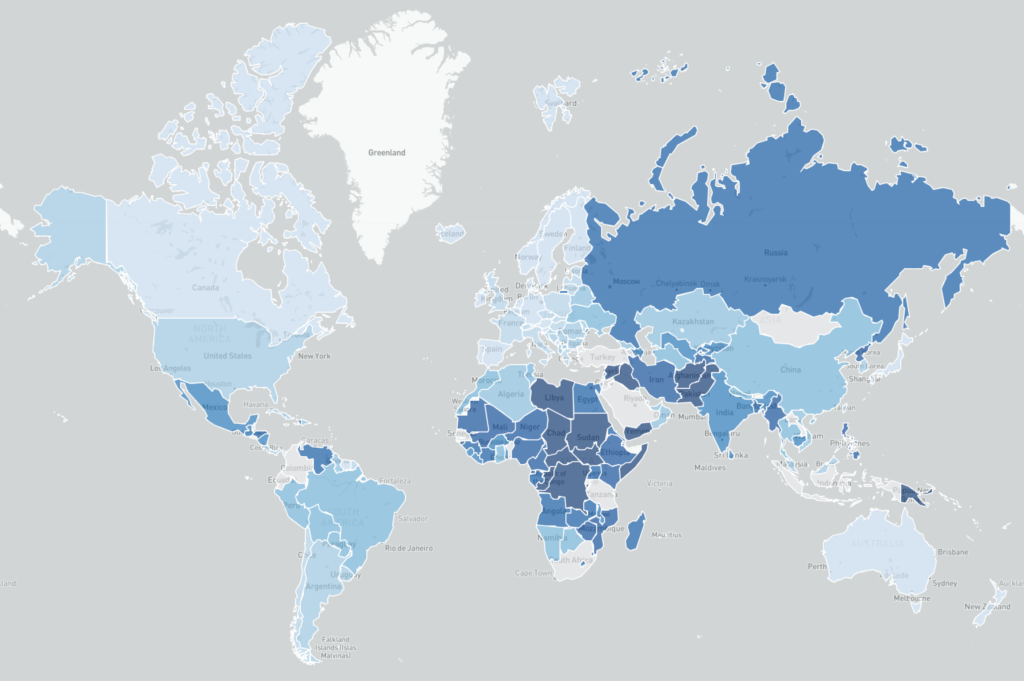
Note the frequent darker blue shades in much of Africa and the Middle East areas; there are many nations with underdeveloped economies and legal systems, posing a threat to the majority of citizens in those countries.
Our final map details the estimated prevalence of modern slavery as of the 2023 report. The general patterns correlate to the vulnerability map, although some very significant differences exist.
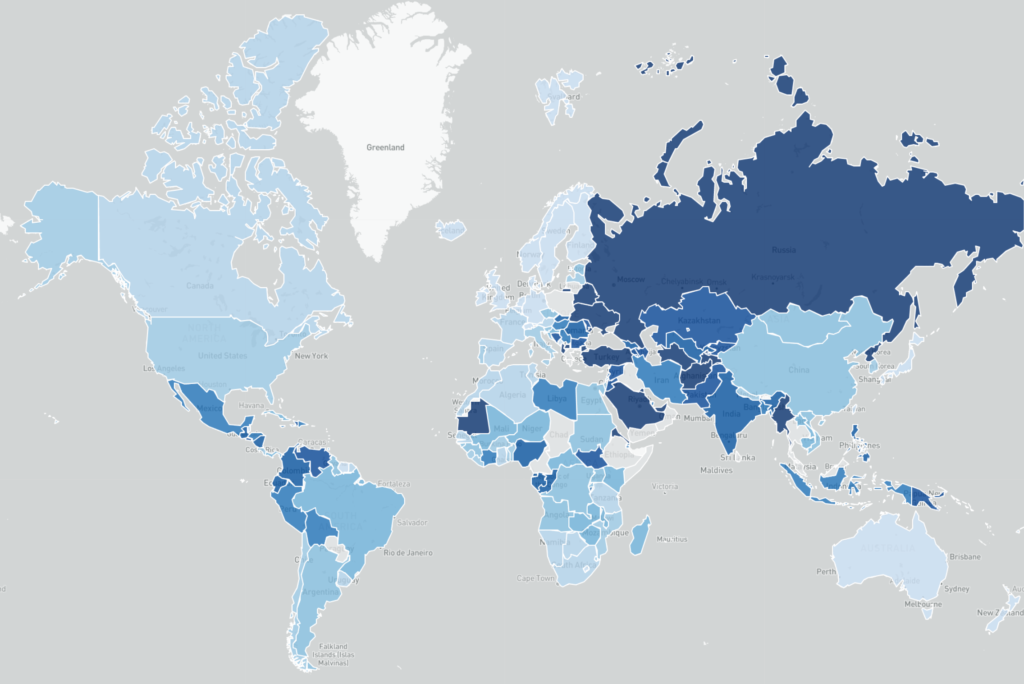
We now see several countries with very high existing slavery rates – Mauritania in West Africa has a staggering 32% modern slavery rate, while Saudi Arabia (21%), Turkey (16%), Russia (13%), Ukraine (13%) and Belarus (11%) also have large segments of the population living as modern slaves.
I hope this has been informative and helped open your eyes to the scope and scale of this shameful human behavior. I’ll likely follow up with some more detail from the Walk Free project; in the meantime, I recommend a visit to their site to learn more about how they define modern slavery and where they source their data. As always, thanks for reading.