I’m finally back in the groove now that Michigan’s biking season has largely ended for all but the most hardcore cyclists, and ready to do some fun analysis and data visualization. All the technical stuff has been updated (WordPress, php, etc.) without too much stress. So, let’s kick things off with a simple example overlaying some Detroit data on various Mapbox styles.
Our data comes courtesy of the City of Detroit Open Data Portal, and contains GeoJSON data for the empowerment zones established between 2006 and 2008. This dataset provides the boundaries for each zone, which can then be overlaid on a variety of map styles, which is where Mapbox enters the picture. We’ll show how this simple dataset displays on three different map styles as an illustration of Mapbox’s capabilities.
First up is a rather striking style where the zones can be formatted to display effectively. Each zone is colored by the number of parcels in the zone, using a gray & blue scale, with darker colors indicating more properties. Here’s a look:
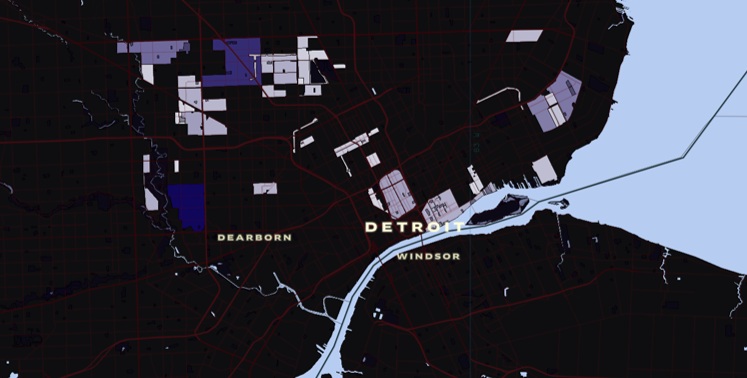
The dark background makes it really easy to spot the empowerment zones but it obscures other features such as parks and even roads, although they become more visible when zooming in on the map in Mapbox. Let’s try a lighter, brighter background with some additional color modifications and see where we land.
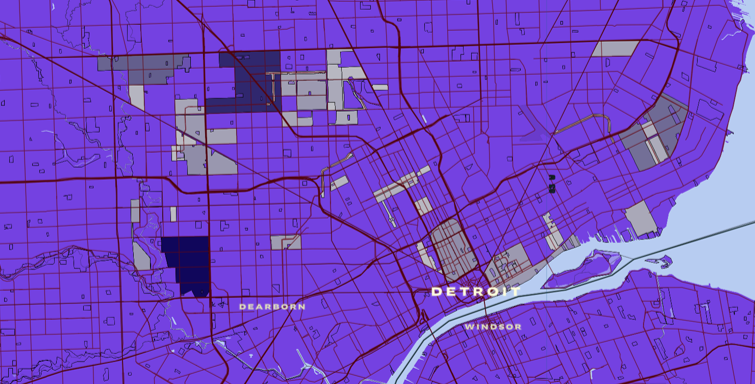
The roads are much more visible in this view and we haven’t lost too much visual information on the empowerment zones. There are still some minor improvements we can make, depending on our end goal. For example, there is no ability to detect parks, and some other features may also be obscured. Let’s go back to Mapbox and tweak a couple color settings in an effort to optimize the map.
We’ll start by making the background a slightly more neutral bluish-gray color while setting the parks color to a brighter shade of blue. We keep the same NEZ and road network colors, with the following result:
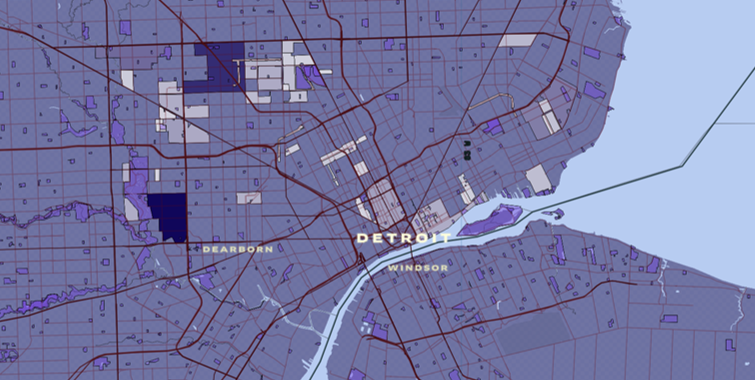
Nice! Now we have more visible context detail for the roads and parks; this is my choice for the best option of the three for this particular exercise. Here’s a live version you can play with, zooming in or out to your heart’s content. Enjoy!