Just a quick post here and a sincere hope that 2022 will be a great year for all of us.
I recently posted an update on the Detroit Land Bank Own It Now program, and wanted to share the latest in the form of a dashboard built with @ExploratoryData software. Here’s a quick look:
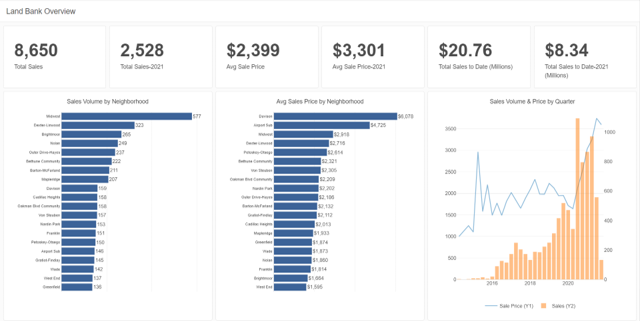
Here’s the live version if you want to see the details.
The dashboard displays some simple metrics, what I often term “the counting statistics”; how many, how much, how often, etc. I’ll be producing some follow-up work that will dig deeper into the details.
That’s all for now, and Happy New Year!