In my previous post on the damage inflicted on the learning trajectories of Michigan 4th graders the focus was on changes between 2019 (pre-lockdown) and 2022 (post-lockdown). We saw the highly discouraging shift in scores between the two periods, with nearly all school districts showing significant declines in student performance levels. In this post our focus is on the actual scores from the two periods; the story will of course be the same, albeit with a slightly different context.
Let’s begin with an Exploratory scatter plot showing the 2019 scores in Math (mth) and Reading Language Arts (rla) for every district in the data, with district names hidden for visual clarity:
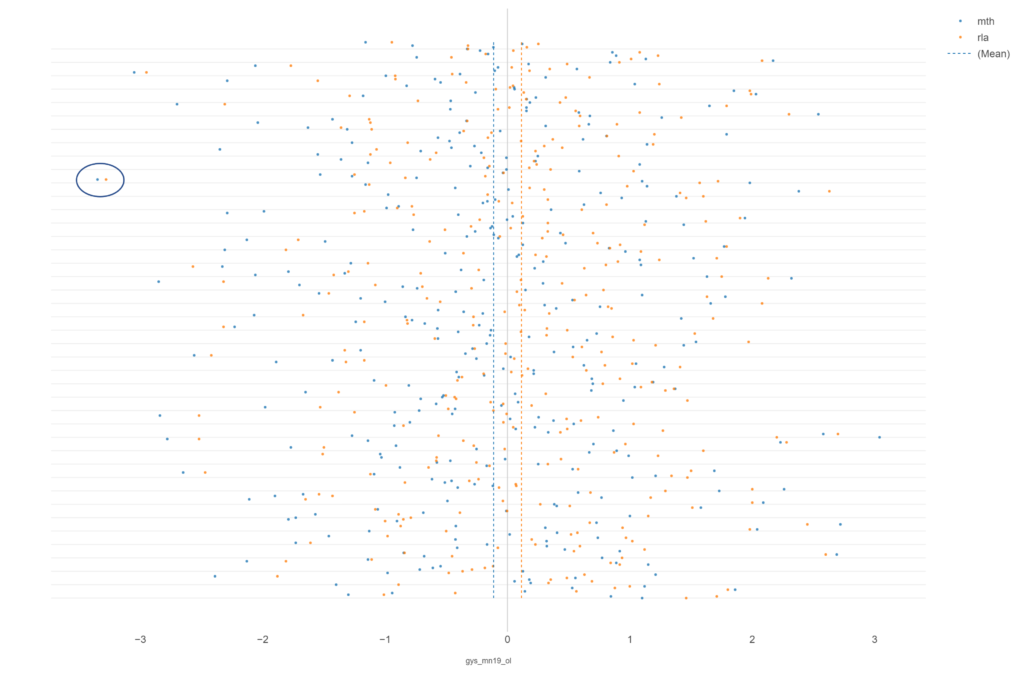
Note the two dotted lines showing the mean scores of all districts – +0.11 for rla, and -0.11 for math. This tells us that Michigan students performed slightly above grade level in rla, and slightly below for math. We can see some districts with scores 2 or even close to 3 grades above expected (i.e.- 4th graders reading at 6th or 7th grade levels), and just as many (or more) at 2 or 3 levels below expectations. Note the circled dots in the upper left of the chart; these show performance in Detroit, the state’s largest district. The scores are troubling and quite frankly unacceptable. Math scores are 3.35 grades below level, with rla at 3.28 grades below 4th grade expectations. In other words, 4th graders in Detroit public schools were performing at barely a 1st grade level in 2019.
Let’s examine 2022 scores:
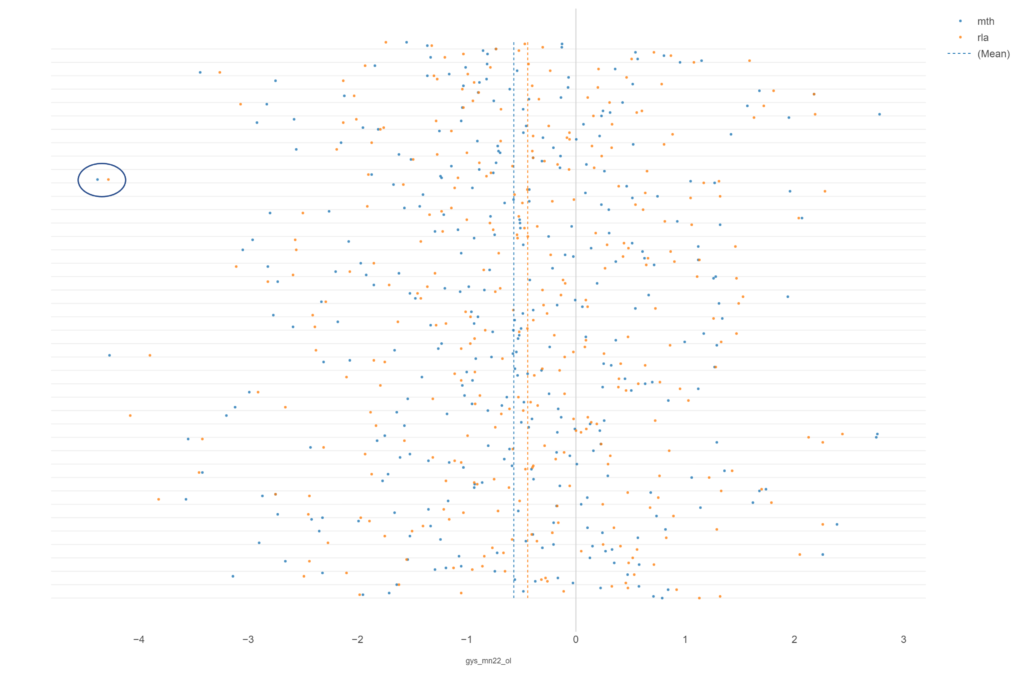
Now our lines have shifted – overall performance is now -0.44 for rla and -0.57 for math; a drop of essentially half a grade level. The average district is now performing well below expected 4th grade levels. What about Detroit? As you might have guessed, the already abysmal performance became even worse; -4.28 grade levels for rla and -4.35 for math. Detroit 4th graders are now performing at kindergarten levels, well on their way to a future of functional illiteracy and innumeracy.
You can interact with the charts in Flourish to see individual district performance, using the first letter filter above the chart. Here is 2019:
And here is 2022:
We’ll continue in future posts to highlight the lockdown impact on an already struggling public education system; people need to understand the damage that has been done. Thanks for reading, and see you soon.