Quick post here – data for the Detroit Land Bank Own it Now program can be viewed in an Exploratory dashboard I recently updated, with sales closing dates through 12-16-2022. One notable trend is that 2022 was much quieter than 2021, which had seen some real spikes in the number of sales across the city. Here’s a screenshot of the dashboard pages:
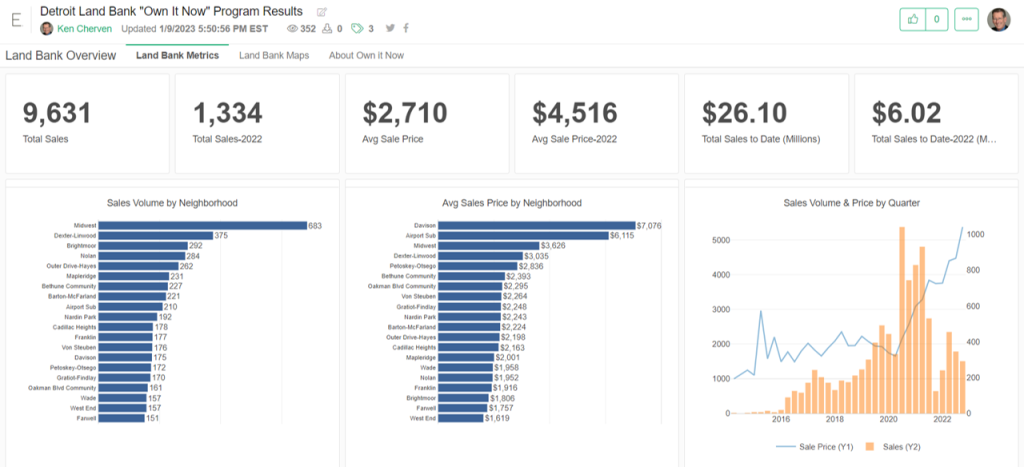
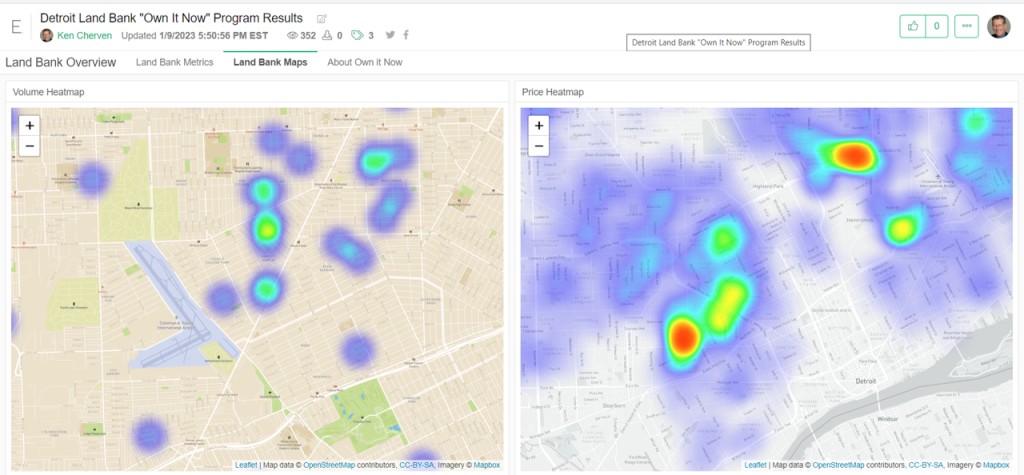
Here’s a link to the dashboard, which shows sales volumes and average prices for the top volume neighborhoods in the city. If you prefer, their are a couple maps to give you a geographic view of where the hotspots are. I’ll be modifying the dashboard periodically to increase it’s value by providing date filters and other improvements. Thanks for reading!